Fig. 1.

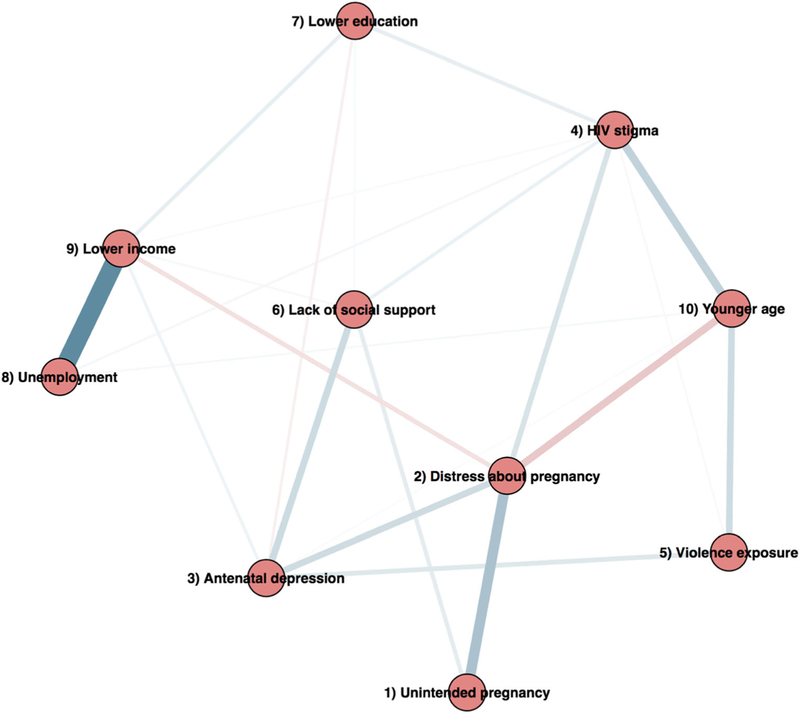
Visualized network of psychosocial risk factors. Strength of each conditional dependency is reflected in weight or intensity of the pairwise edge. Positive edges shown in blue, negative edges in red (in color figure)

Visualized network of psychosocial risk factors. Strength of each conditional dependency is reflected in weight or intensity of the pairwise edge. Positive edges shown in blue, negative edges in red (in color figure)