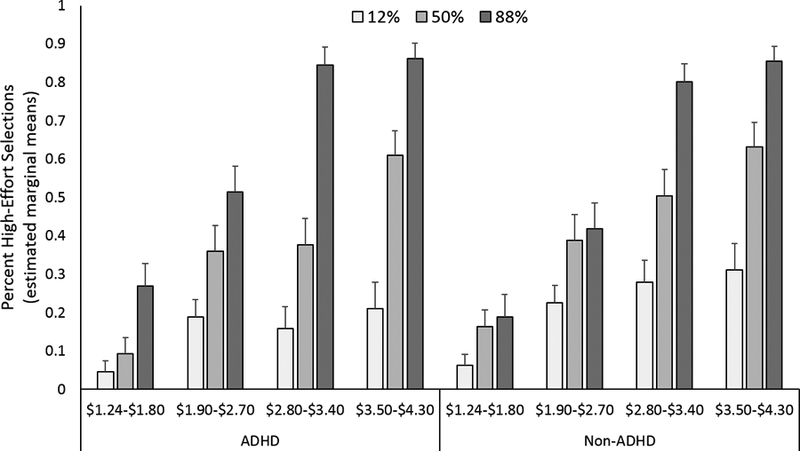
Figure 2.

The percent high-effort selections made across reward magnitude (x-axis) and reward probability (different colored bars) in ADHD (on the left) and non-ADHD (on the right) groups. Across all participants and drug conditions, high-effort selections increased as reward magnitude and probability increased (p’s < .05). Shown are the estimated marginal means (including age as a covariate of no interest). Error bars are S.E.M.
