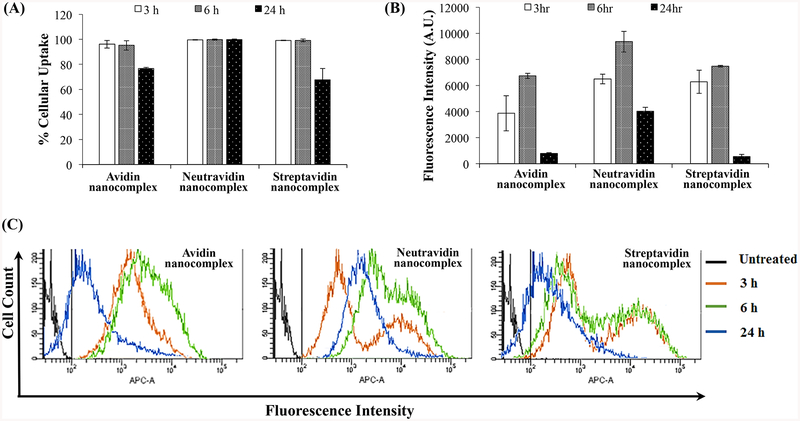
Figure 5.
Quantitative cellular uptake study of the avidin-, neutravidin- and streptavidin-based nanocomplexes. Cellular uptake of nanocomplexes encapsulating Alexa Fluor-647 labeled siRNA was quantitated using flow cytometry. (A) Percent of cells that take up the nanocomplex; (B) Fluorescence intensity of the cells at various time points; (C) Histogram Plot for the Alexa Fluor-647 siRNA mediated intensity peak shift by avidin-, neutravidin- and streptavidin-based nanocomplexes at various time points. The negative control gate was set at 102 APC-A (shown in black). APC-A is the equivalent fluorescent filter for the Alexa Fluor-647.

