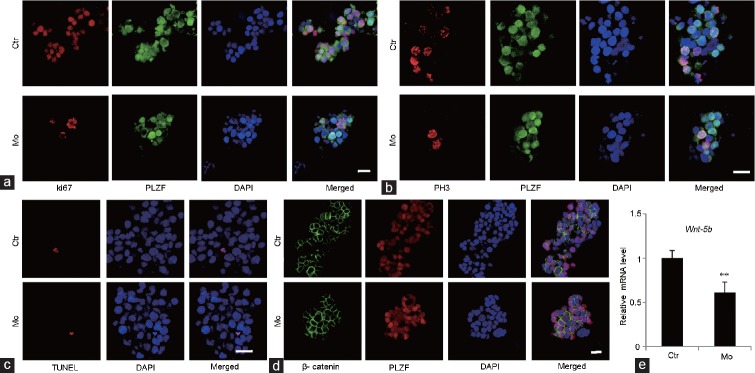
Figure 6.
Influence of SBNO1 knockdown in SSC culture. (a) Representative images of Ki-67 (proliferative cell marker, red) and PLZF (undifferentiated spermatogonia marker, green) immunostaining in Ctr and Mo SSCs. (b) Representative images of PH3 (proliferative cell marker, red) and PLZF (green) immunostaining in Ctr and Mo SSCs. (c) Representative images showing results of the TUNEL assay (red) in Ctr and Mo SSCs. (d) Representative images of β-catenin (green) and PLZF (red) immunostaining in Ctr and Mo SSCs. (e) Wnt5b mRNA levels in Ctr and Mo SSCs. **P < 0.01, Student's t-test, n = 3. Scale bars = 20 μm. Ctr: negative control; Mo: morpholino-treatment; SBNO1: Strawberry Notch 1; SSCs: spermatogonial stem cells; KI67: marker of proliferation Ki-67; PH3: phospho-histone H3; TUNEL: terminal deoxyribonucleotidyl transferase (TDT)-mediated dUTP-digoxigenin nick-end labeling; PLZF: promyelocytic leukemia zinc finger; DAPI: 4',6-diamidino-2-phenylindole; Wnt-5b: wingless-type MMTV integration site family member 5B; MMTV: murine mammary tumor virus.

