
Figure 2.
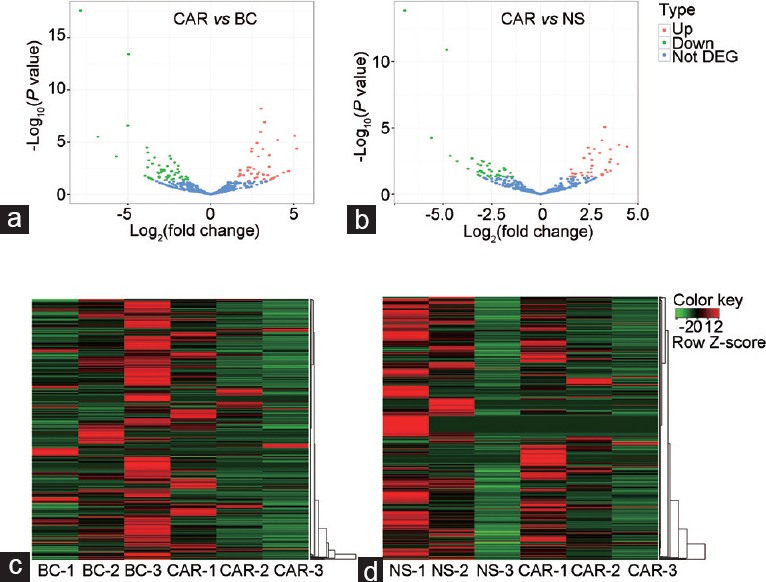
The overview of the volcano plot generated by miRNA profile and clustering heat maps of differentially expressed miRNA. The volcano plot generated by miRNA expression profile from small RNA NGS between prostatic tissues (a) treated with CAR or without any treatment (BC) and (b) treated with CAR or NS. The red points in the plot represent significantly upregulated miRNAs and the green points represent significantly downregulated miRNAs, while the blue points show no statistically significant differences due to either small fold change (<2) or insignificant P values. The heat map of miRNA expression profile between prostatic tissues (c) treated with CAR or without any treatment (BC) and (d) treated with CAR or NS. For c and d, each column represents a certain sample and lines represent different genes; the corresponding color represents the amount of gene expression in the sample: red color indicates higher expression and green represents lower expression. DEG: differentially expressed genes; BC: blank control group; NS: normal saline group; CAR: carrageenan group.