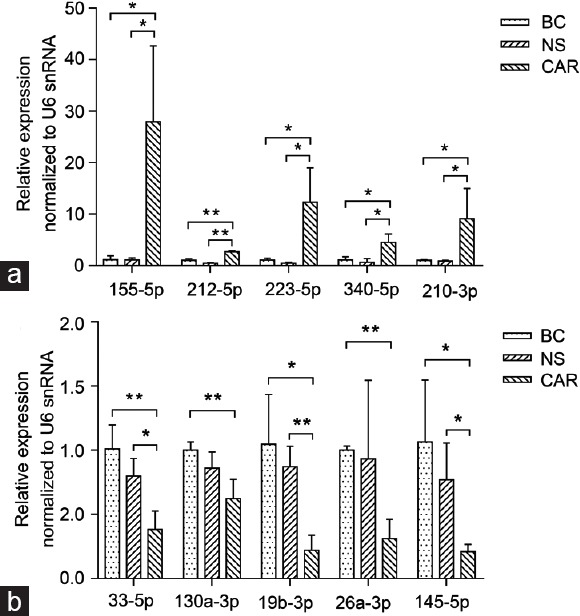
Figure 3.

Relative expression of (a) five upregulated and (b) five downregulated miRNAs in BC, NS, and CAR groups at day 7 after model establishment (n=3 for each group). Data are presented as mean ± s.e.m. *P < 0.05, **P < 0.01 BC: blank control group; NS: normal saline group; CAR: carrageenan group; s.e.m: standard error of the mean.
