
Figure 4.
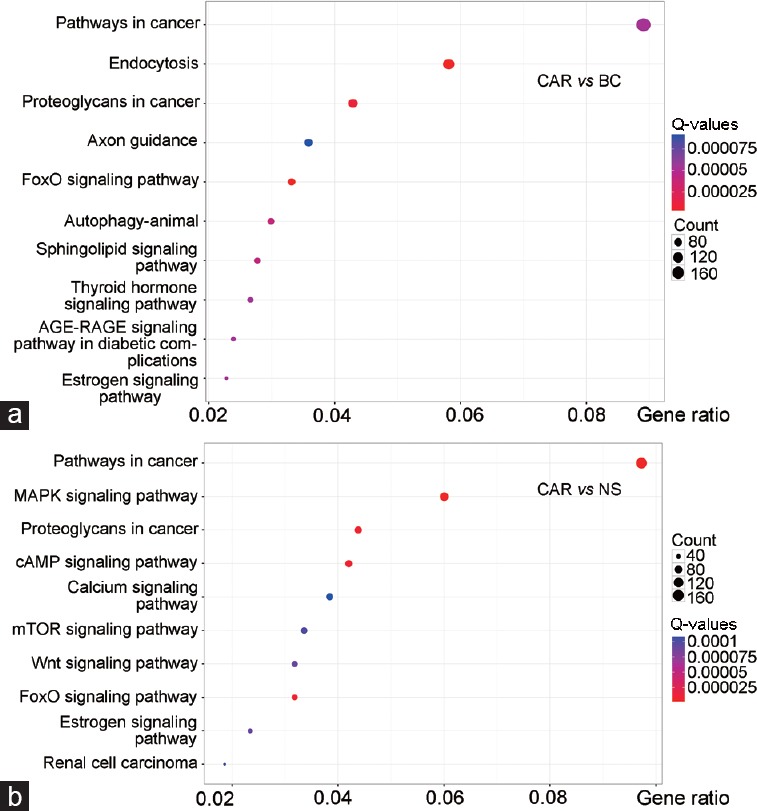
KEGG enrichment dot plot for target genes of differentially expressed miRNAs (CAR vs BC and CAR vs NS). The top ten enriched KEGG pathways are presented. The X-axis represents enrichment factor, indicating the proportion of differentially expressed genes in all annotated genes on certain signaling pathway. The Y-axis represents log10 (Q-values). Enriched pathways with higher X and Y values possessed better statistical significances. (a) CAR versus BC; (b) CAR versus NS. BC: blank control group; NS: normal saline group; CAR: carrageenan group; KEGG: Kyoto Encyclopedia of Genes and Genomes; FoxO: forkhead box O; AGE-RAGE: advanced glycation end products-receptor for advanced glycation end products; MAPK: mitogen-activated protein kinase; cAMP: cyclic adenosine monophosphate; mTOR: mammalian target of rapamycin; Wnt: wingless/int 1; Q-values: adjusted P values.