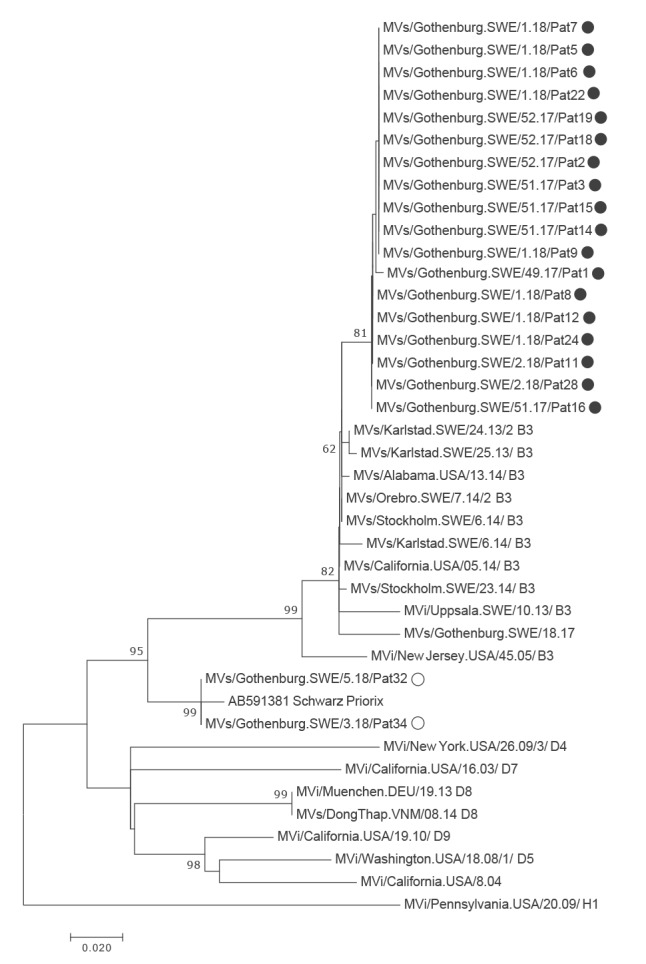
Figure 3.
Phylogenetic tree based on maximum likelihood analysis of a 400 nt segment from the hypervariable region of measles virus, measles outbreak, Gothenburg, December 2017–January 2018 (n =20)
The tree includes 20 sequences from samples taken during the measles outbreak in Gothenburg, Sweden and a selection of sequences representing different subgenotypes and sampling time points, including viruses identified in Sweden during earlier outbreaks. Bootstrapping was done to 500 replicates, using the MEGA7 software. Black filled circles: 18 B3 strains; open circles: two vaccine strains. A distance scale bar is included.

