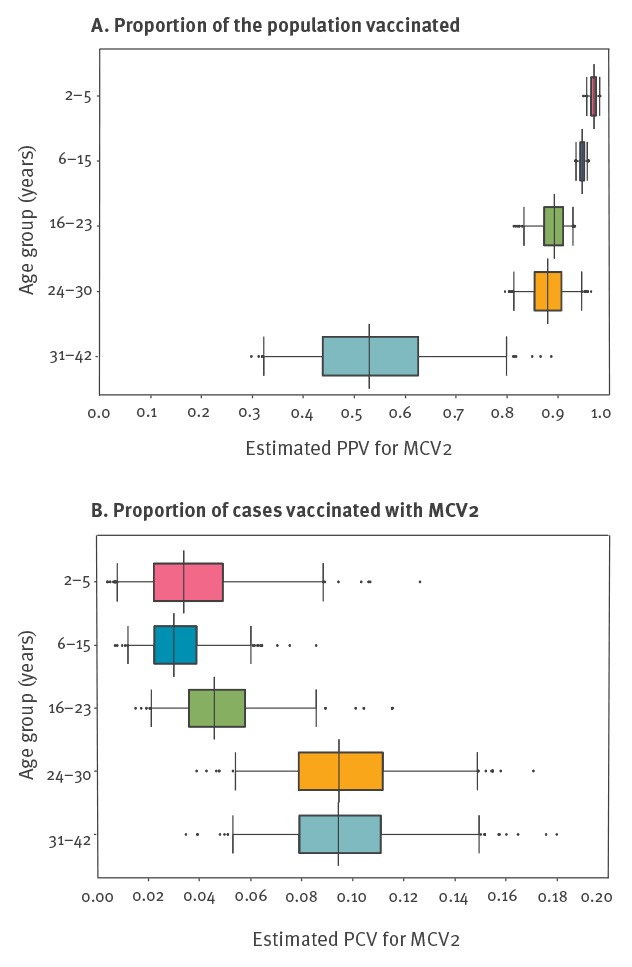
Figure 1.
Probability distributions representing the estimated (A) proportion of the population vaccinated and (B) proportion of cases vaccinated with MCV2, by age group, Berlin, October 2014–August 2015
MCV: measles-containing vaccine; PCV: proportion of cases vaccinated; PPV: proportion of the population vaccinated.
Boxes represent the interquartile range. The median is marked by a black line and the whiskers represent the range from p2.5 to p97.5. Outliers are marked as black points.