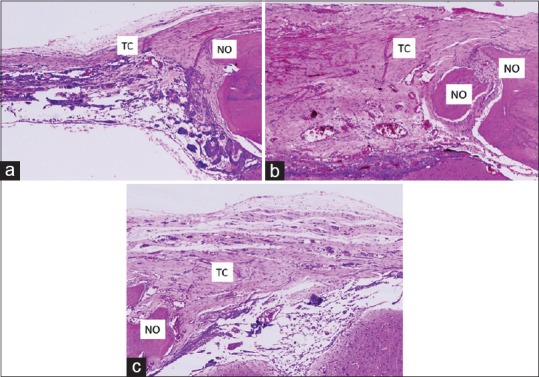
Figure 3.

Histological section of experimental groups at 90 days: enlarged image (H and E, ×40). (a) Control group: discrete bone neoformation from the margins of bony defect, with the presence of connective tissue; (b) Noncoaptation group: bone neoformation toward the center of the bone defect, with the presence of fibrous connective tissue; (c) Coaptation group: bone neoformation toward the center of the bony defect, with the presence of organized and vascularized connective tissue. NO – Neoform bone; TC – Connective tissue
