Figure 1.

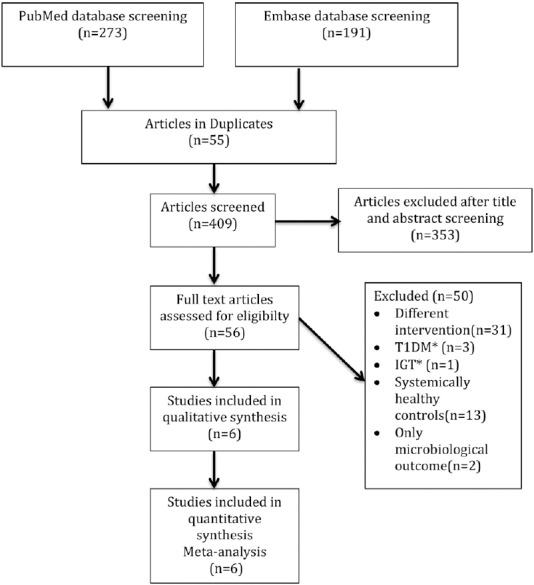
Flow diagram representing the selection process (T1DM* – Type 1 diabetes mellitus, IGT* – Impaired glucose tolerance). n – Number of articles

Flow diagram representing the selection process (T1DM* – Type 1 diabetes mellitus, IGT* – Impaired glucose tolerance). n – Number of articles