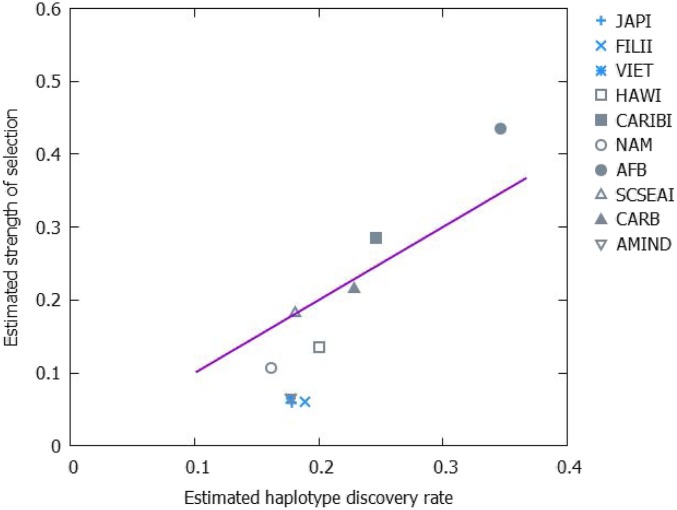
Fig. 6.
Dependency of the estimated selection strength on the haplotype discovery rate. Estimated strength δ of positive frequency-dependent selection at the level of haplotypes is plotted against the estimated haplotype discovery rate. The populations are divided into heterogeneous (gray) and homogeneous (blue). The Spearman rank correlation is ρ = −0.703 and the P value is 0.022.

