Fig. 3.
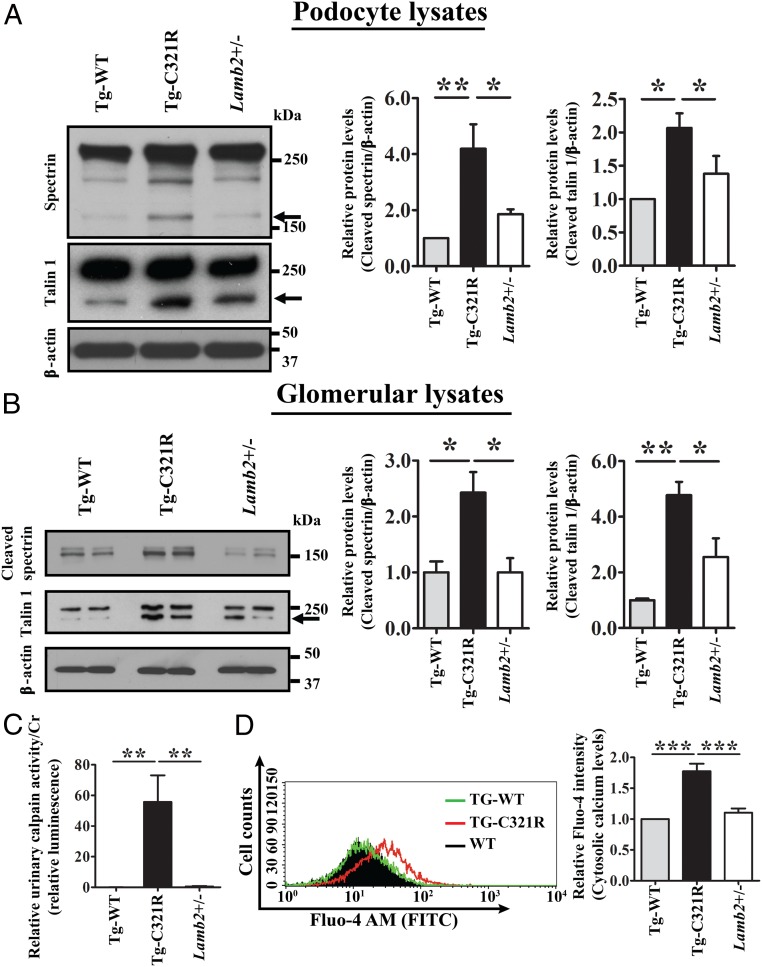
Podocyte ER stress induces cytosolic calcium elevation and activation of calcium-dependent calpain 2 activity. (A) Primary podocyte lysates from Tg-WT, Tg-C321R, and Lamb2+/− mice at P27 were analyzed by WB for cleavage of spectrin and talin 1. The arrows indicate cleaved spectrin or talin 1. Quantification of cleaved spectrin and talin 1 was normalized to β-actin in primary podocyte lysates. Mean ± SD of 5 independent experiments. *P < 0.05, **P < 0.01 by ANOVA. (B) Glomerular lysates from Tg-WT, Tg-C321R, and Lamb2+/− mice at P27 were analyzed by WB for cleaved spectrin and talin 1. The arrow indicates cleaved talin 1. Quantification of cleaved spectrin and talin 1 was normalized to β-actin in glomerular lysates. Mean ± SD of 5 independent experiments. *P < 0.05, **P < 0.01 by ANOVA. (C) Urinary calpain activity/Cr was assayed from the indicated groups at P25–P27. The urinary calpain activity/Cr in Lamb2+/− mice was set as 1 (n = 5 per group). **P < 0.01 by ANOVA. (D) Tg-C321R and control podocytes were stained with the cytosolic calcium indicator Fluo-4 AM, and the fluorescence intensity was measured by flow cytometry. The relative fluorescence intensity was expressed as mean ± SD from 3 independent experiments. ***P < 0.001 by ANOVA.

