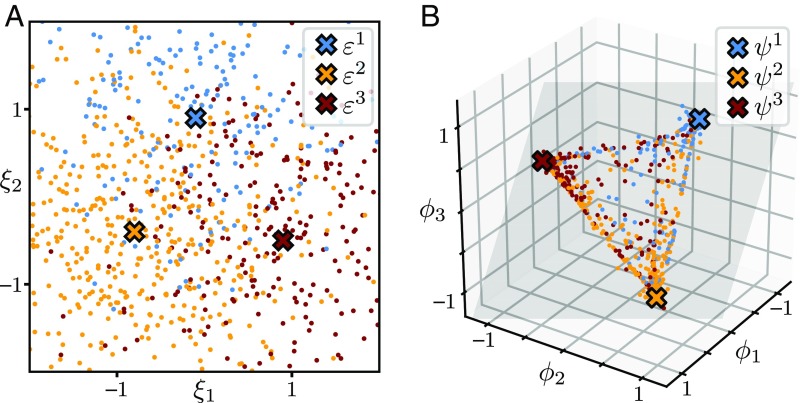
Fig. 2.
Example of an adaptation strategy produced by an optimized network. (A) Distribution of environmental cues represented by points in the environment space (color represents the actual environmental condition ). (B) Distribution of phenotypes produced by the optimized network, represented by points in the phenotype space. All points fall on a plane (gray shaded) spanned by the archetypes . For these plots we used parameter values for environmental noise and for selection strength, which represent characteristic scales that are of the same order as the distance between two environments and between two archetypes , respectively.

