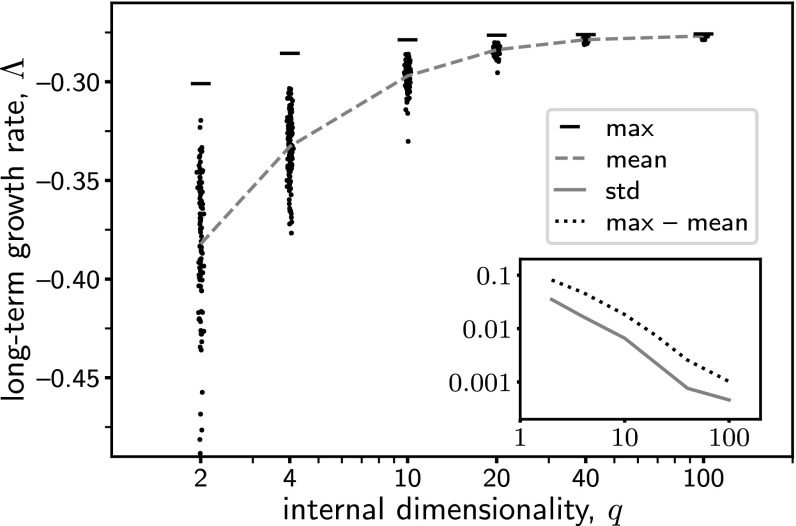
Fig. 5.
Long-term population growth rate vs. the dimensionality of the intermediate layer of the network. Each point represents a network with a random, fixed representation matrix (entries drawn from independently) and an optimized expression matrix . (To aid visualization of the density of points, a small random horizontal displacement is added.) Dashed and solid (Inset) lines show the mean and SD of the values of . Horizontal bars mark the maximum values of when the matrix is also optimized for each ; dotted line (Inset) shows the difference between the maximum and the mean values. For this example the parameter values and are used.

