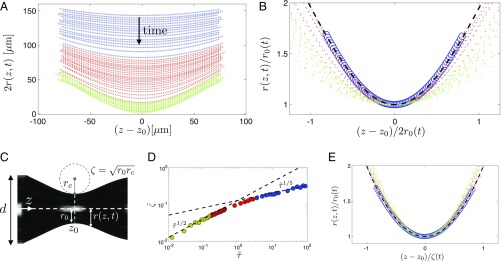
Fig. 3.
Self-similarity of the neck profile. (A) The evolution of the bubble neck profile in time (data corresponding to , , and ); blue and green symbols represent the data corresponding to the early and late-time self-similar regimes, and red symbols represent the transition between the two. (B) Scaling the neck profile with the minimum neck diameter collapses the data corresponding to the early-time self-similar regime, where and . The dashed line, overlaying the blue symbols corresponding to the early-time self-similar regime, represents the self-similar solution of the long-wave model (SI Appendix, section 2). The data corresponding to the late-time self-similar regime, however, deviate from the predictions of the long-wave model. (C) The definition of parameters used to characterize the bubble neck profile. (D) The evolution of the axial length scale defined as versus time to pinch-off. In the early-time regime, , consistent with the predictions of the long-wave model. In the late-time regime, however, and , which indicates that the axial radius of curvature becomes constant, i.e., the neck profile becomes a parabola that simply translates in time (13, 42). (E) Scaling the axial length scale with the expressions obtained in D leads to the collapse of all bubble neck profiles during the entire pinch-off process (shown in A) onto a single parabolic curve: (dashed line).

