Fig. 2.
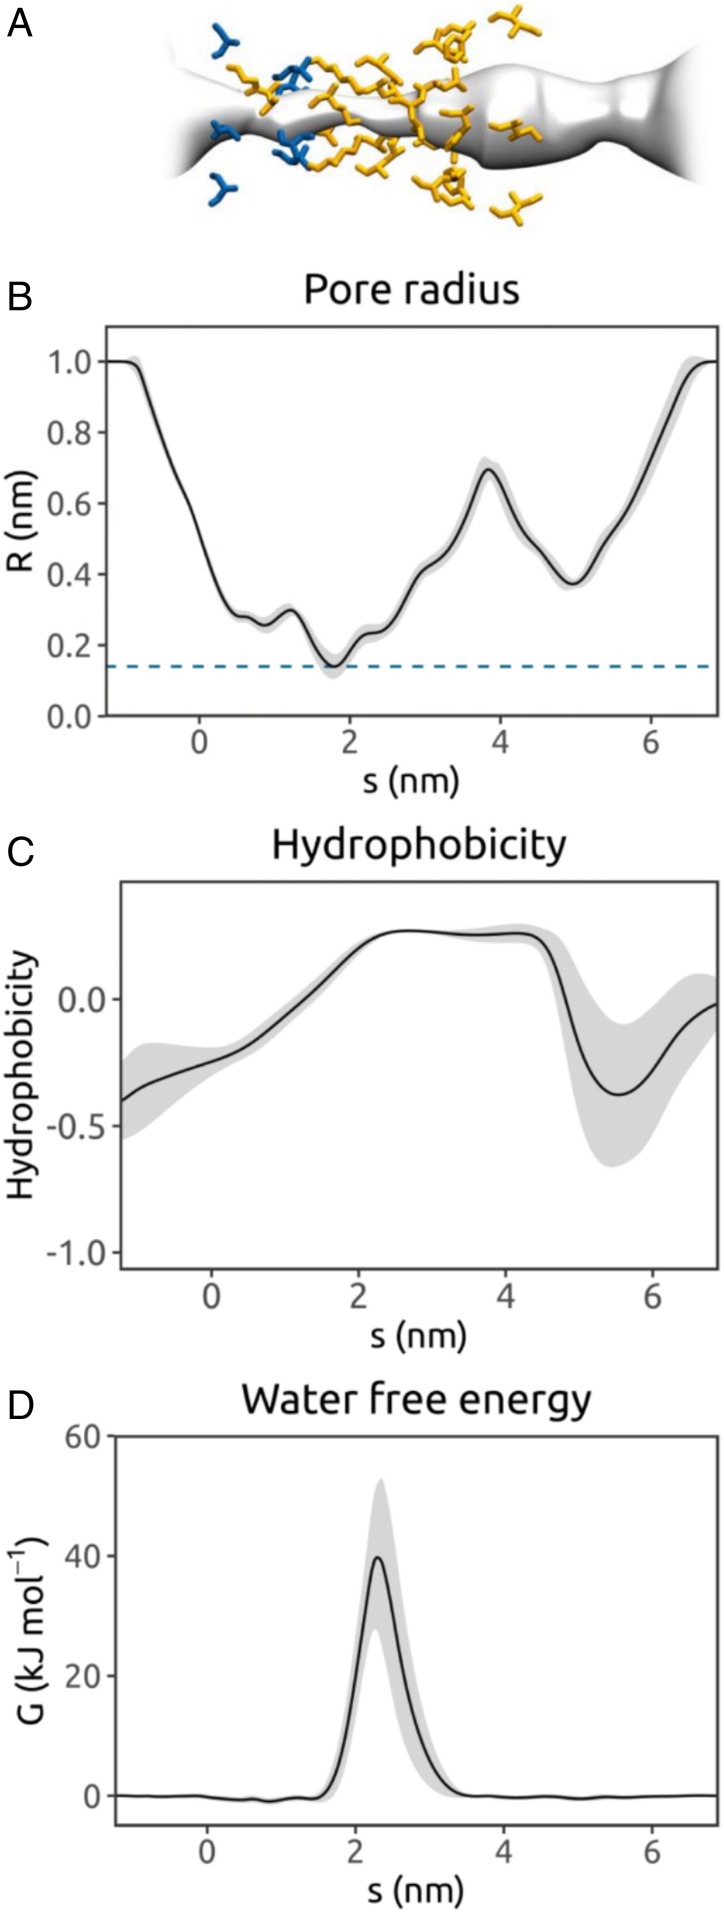
Annotation of an ion channel structure via MD simulations of water within the pore, (A) illustrated for the TRPV4 ion channel (PDB ID code 6BBJ) (47). (B) Pore radius profile derived from 1 of 3 × 30-ns simulations of the protein embedded in a phospholipid bilayer. The mean radius, calculated using the final 20 ns of the trajectory with a sampling interval of 0.5 ns, is shown as a black line (with the gray band representing the SD over time) as a function of position, s, along the pore axis. The pore-lining surface and the pore-lining residues of the channel (hydrophobic in orange; polar in blue) are shown at the top. (C) Hydrophobicity profile for the pore-lining side chains as a function of position along the pore axis s. The hydrophobicity values are evaluated using a normalized version of the Wimley–White scale (48). (D) Free energy for water as a function of position along the pore axis s. The free energy profile is obtained from the density of water within the pore as estimated from the MD simulation (details in Methods).

