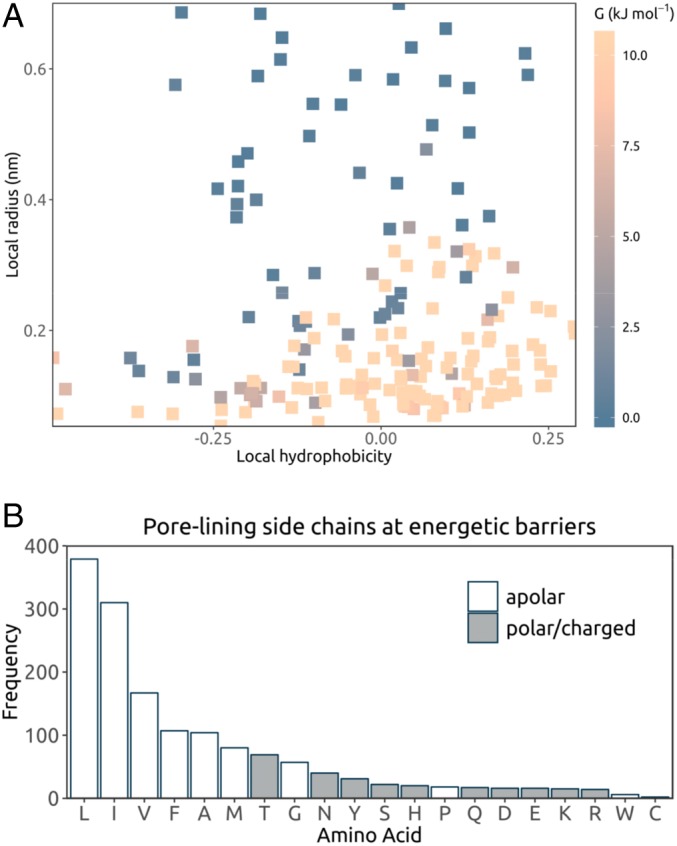
Fig. 3.

(A) Analysis of the main energetic barrier to water permeation in each ion channel structure. Each point corresponds to a single channel structure (details in SI Appendix, Table S1), indicating the hydrophobicity and pore radius at the highest barrier in the water free energy profile (averaged across the 3 repeat simulations). The height of the barrier is given by the color scale. Points with energy values outside the range are shown in the same color as the lower or upper boundary. For structures containing a narrow pore-loop selectivity filter (e.g., K+ channels), the section on their water free energy profile corresponding to the filter region is excluded when locating the maximum energy point to represent the structure. (B) Frequency of the different pore-lining side chains at an energetic barrier in these ion channel structures, that is, where the water free energy is >1.5 RT (3.9 kJ mol−1) at the mean position of the residue along the pore axis s. Multiple amino acids may occur at each energetic barrier.
