Fig. 5.
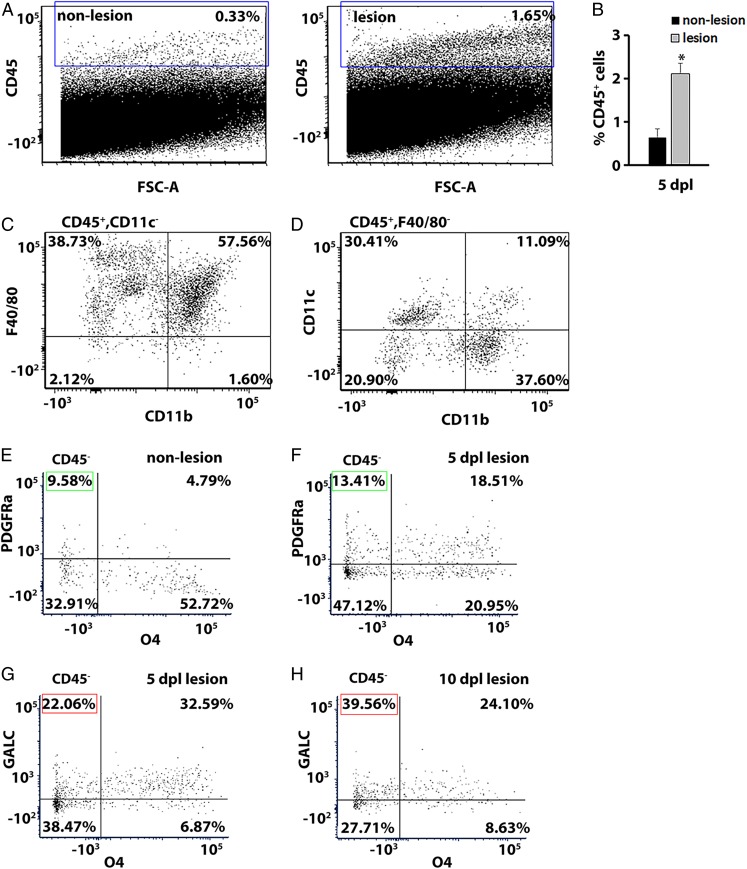
Flow cytometry analysis of immune cell populations in the CNS lesion. (A) Representative plots of flow cytometry analysis showing the percentage of CD45+ cells in NR-nonlabeled control (0.33%) and NR-labeled lesion (1.65%) tissue. (B) Quantification of CD45+ cells in the lesion compared with adjacent unlabeled nonlesion tissue at 5 dpl. Data are presented as mean ± SEM. *P < 0.05. (C) Representative plots showing a population of F4/80+ CD11b+ macrophage cells among the cells gated on CD45+ CD11c−, found in the lesion at 5 dpl. (D) Representative plots showing that among CD45+ F4/80− cells, CD11b− CD11c+ lymphoid dendritic cells and CD11b+ CD11c+ myeloid dendritic cells were detected in the lesion at 5 dpl. (E–H) Representative plots showing a population of CD45− oligodendrocytes labeled by Pdgfra (progenitor marker) and O4 (intermediate marker) in nonlesion (E) and at 5 dpl in lesion tissue (F). Green box indicates OPC population (Pdgfra+O4−). The percentage of mature oligodendrocytes was assessed by GALC at 5 dpl (G) and 10 dpl (H). Red box indicates mature oligodendrocytes (GALC+O4−).

