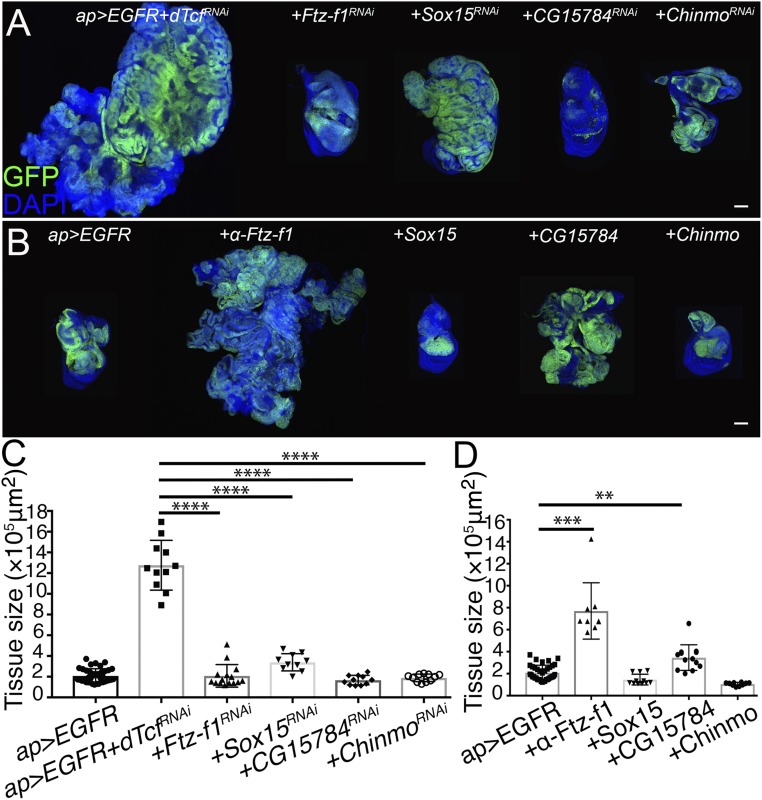
Fig. 7.
Ftz-f1, Sox15, CG15784, and Chinmo contribute to EGFR + dTcf/PanRNAi tumor formation. (A) Confocal micrographs of ap-Gal4, UAS-GFP, UAS-EGFR, UAS-dTcf/PanRNAi tumorous disk (Left), expressing of Ftz-f1RNAi, Sox15RNAi, CG15784RNAi, and ChinmoRNAi as indicated in the figure (panels on the Right). (B) Confocal micrographs of ap-Gal4, UAS-GFP, UAS-EGFR wing imaginal disk (Left) expressing α-Ftz-f1, β-Ftz-f1, Sox15, CG15784, and Chinmo as indicated in the figure (panels on the Right). GFP is shown in green. Nuclei are labeled with DAPI (blue). All of the images were taken under the same magnification (Scale bars, 100 μm). (C) Tissue-size quantification of wing imaginal discs in A (Unpaired t test, n = 37, 11, 15, 10, 11, 11 from left to right, ****P < 0.0001). (D) Tissue-size quantification of wing imaginal discs in B (Unpaired t test, n = 37, 9, 11, 13, 10 from left to right, ***P < 0.001, **P < 0.01).

