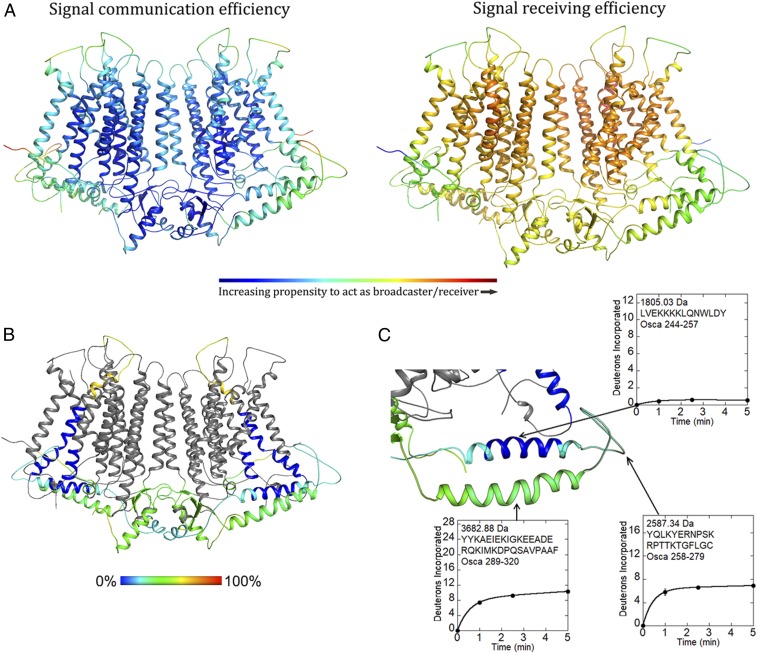
Fig. 3.
Computational and experimental dynamics of OsOSCA1.2. (A) Results of OsOSCA1.2 embedded in the membrane using the DynOmics suite. Panels show a color-coded map superimposed on the model illustrating signal communication (Left) and receiving (Right) efficiency. Regions that are colored red are more active, while those that are colored blue are inactive with regard to molecular dynamics prediction. (B) Relative uptake after 5 min of exchange. The structure is color-scaled and superimposed on the model. Regions colored gray yielded no detectable peptide fragments. (C) Close-up view of the extended and gating helix. Uptake plots for selected peptides are shown. Corresponding protein segments are outlined.

