Fig. 1.
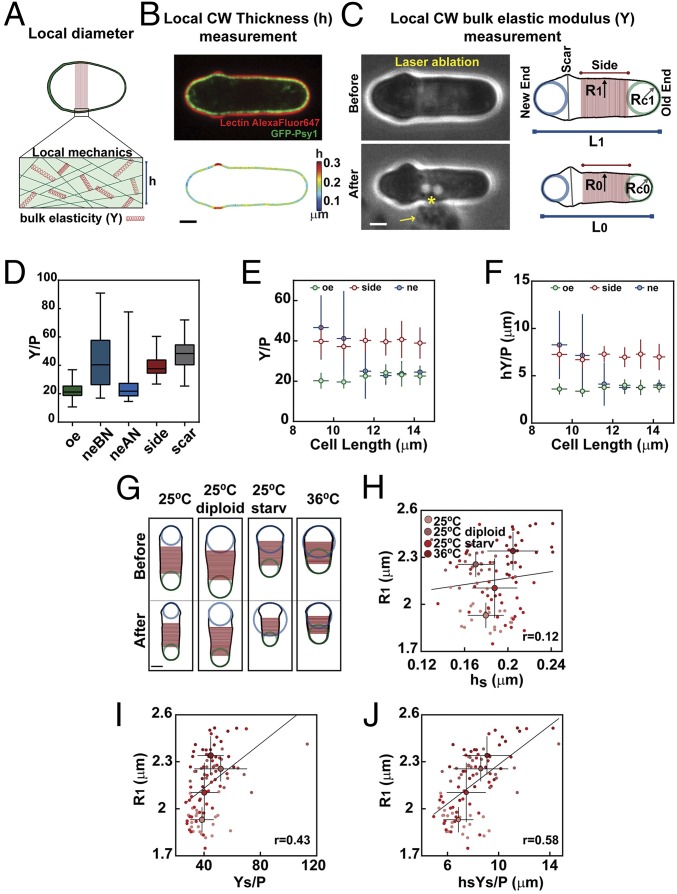
A method to compute local CW mechanical properties in S. pombe cells. (A) Schematic of a cell with varying diameters, with enlarged view of local CW organization defining thickness (h) and bulk elastic modulus (Y). (B) Midslice confocal image of a cell expressing GFP-Psy1 and labeled with lectin GS-IB4–Alexa Fluor 647 (Upper), and the corresponding CW thickness map (Lower). (C, Left) Method to estimate local wall bulk modulus divided by turgor pressure. Bright-field images of the same cell depicted in B before (Upper) and after (Lower) laser ablation. The asterisk indicates the laser-ablating spot; the arrow points at a cloud of ejected cytosolic material. (C, Right) CW boundaries of the same cell before (Upper) and after (Lower) ablation, used to compute local radii of curvature at cell tips and the radius along the cell side, defined as a mean on the red region. (D) Y divided by turgor pressure (P) values computed at old end (oe, n = 99), new end before (neBN, n = 20), and new end after (neAN, n = 64) NETO, and at sides (n = 99) and scars (n = 27) in a WT population. (E and F) Evolution of Y/P (E) and hY/P (F) as a function of cell length. Individual cells have been imaged and binned by length (between 8 and 20 cells for each point). (G) CW boundaries, before and after ablation, of typical WT haploid and diploid cells, and haploid cells after 16 h of starvation (25 °C starv) and at 36 °C in exponential phase. (H–J) Cell radius (R1) plotted as a function of side wall thickness (hs), side bulk modulus divided by pressure (Ys/P), or surface modulus divided by pressure (hsYs/P) (for 25 °C, n = 21; 25 °C diploid, n = 19; 25 °C starv, n = 34; and 36 °C, n = 24). Small dots correspond to single cells, and larger dots are mean values. The line is a linear fit on single-cell measurements. r values are Pearson correlation coefficients. Whisker plots represent median and full dataset range. Error bars are SDs. (Scale bars, 2 μm.)

