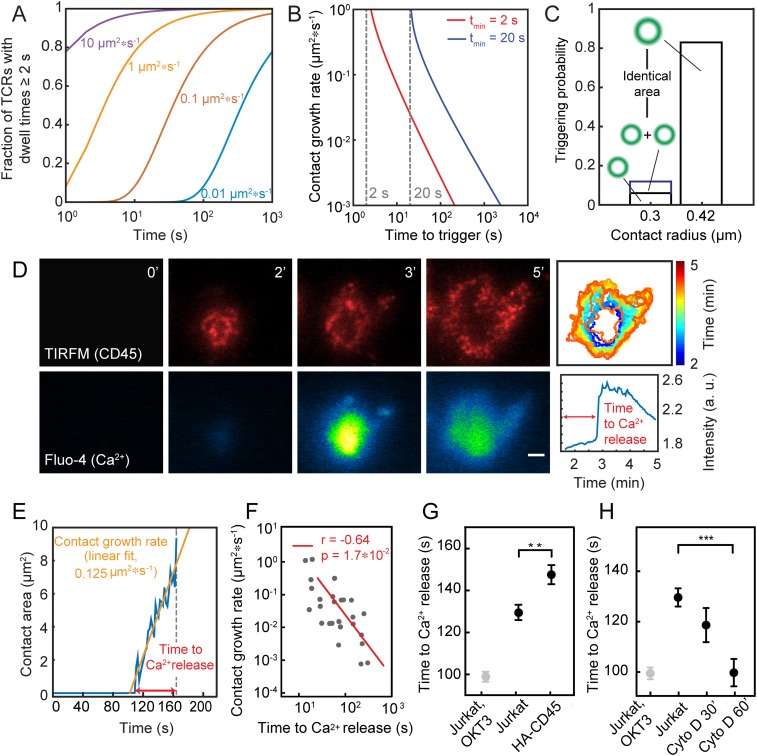
Fig. 3.
Experimental validation of the model. (A) Fraction of triggered TCRs as a function of time and contact growth rate (tmin = 2 s, D = 0.05 µm2/s, g = 0.01 to 10 µm2/s). (B) Time taken to TCR triggering as a function of close-contact growth rate. (C) Comparison of triggering probability for one versus two contacts or a single contact of double the contact area. (D) Dynamics of close-contact formation [CD45 fluorescence (Gap 8.3 Fab, Alexa Fluor 568), TIRFM] (Top) and Ca2+ release (detected as Fluo-4 fluorescence) (Bottom) for cells contacting rCD2-presenting SLBs. (Scale bar, 2 μm.) (Top Right) Color-coded representation of the temporal evolution of contact area over time. (Bottom Right) Temporal evolution of Fluo-4 intensity averaged over entire contact; n > 10 cells from five independent experiments. (E) Trace of a representative contact over time for growth-rate determination. (F) Relationship between close-contact growth rate and the time taken to triggering. (G) Time delay between initial contact of cells with rCD2-presenting SLBs and Ca2+ release for Jurkat T cells and cells expressing HA-CD45. (H) Time delay between initial contact of cells with IgG-coated glass and Ca2+ release in the presence of the actin depolymerizing drug cytochalasin D (data shown as mean time of calcium release for three independent experiments with >200 cells per condition; **P = 0.01 and ***P <0.001, two-tailed t test, unequal variance assumed; errors are SEM).

