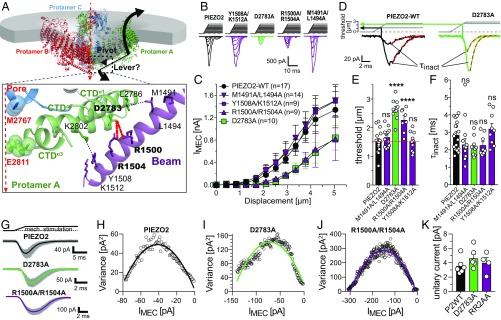
Fig. 2.
Noncovalent interactions between the beam and the CTD facilitate mechanical activation of PIEZO2. (A) The beam domain has been proposed to act as a lever that rotates around a pivot constituted by the beam–CTD interface. Bottom shows a magnified view of the beam–CTD interface of PIEZO2 with the possible noncovalent interactions being depicted by dashed lines. (B) Example traces of mechanically activated currents evoked by increasing mechanical stimuli (Top) mediated by the indicated PIEZO2 mutants in N2a-P1KO cells. Note that D2783A and R1500A/R1504A mutants generate much smaller currents that PIEZO2-WT. (C) Displacement–response curves (mean ± SEM peak current amplitudes) of the indicated PIEZO2 mutants. N numbers are shown in the graph. (D) Example traces of PIEZO2-WT currents (Left) and D2783A currents (Right) are shown to illustrate how the mechanical thresholds that are compared in E were determined and how the inactivation time constants shown in F were determined by fitting the currents with a single exponential equation. (E) Comparison of the mean ± SEM activation thresholds of the mechanically activated currents mediated by the indicated channel mutants using one-way ANOVA with Dunnett’s multiple-comparison test. ****P < 0.0001. (F) Comparison of the mean ± SEM inactivation time constants (τinact) using one-way ANOVA with Dunnett’s multiple-comparison test. (G) Superimposed example traces (gray) of currents from the indicated mutants evoked by 100 consecutive and identical mechanical stimuli. The thick black, green, and purple lines show the mean response waveforms obtained by averaging all currents. (H–J) The variance of the difference between the measured and the scaled mean waveform at each sampling point is plotted against the current amplitude of the mean scaled waveform in 1-pA bins and fitted using the equation σ2 = σ02 + iI – I2/N, where i is the single-channel current (see Materials and Methods and SI Appendix, Fig. S3 for details). (K) Comparison of the mean single-channel currents ± SEM.

