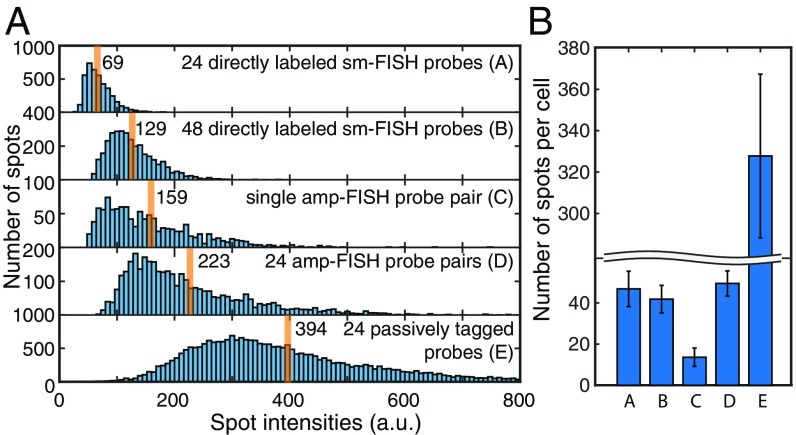
Fig. 4.
Comparison of intensities and number of spots produced by 5 different probe sets for the imaging of EGFR mRNAs in H1975 cells. (A) Distribution of spot intensities of the brightest pixel within each spot (cumulative measurements: 55–70 cells) produced by each of the indicated probe sets. Orange lines identify the average spot intensity for each distribution. (B) Average number of spots per cell detected with each of the 5 probe sets. Probe sets A, B, D, and E were expected to detect all target mRNAs, whereas probe set C was expected to detect only the minor wild-type fraction of the target mRNAs.

