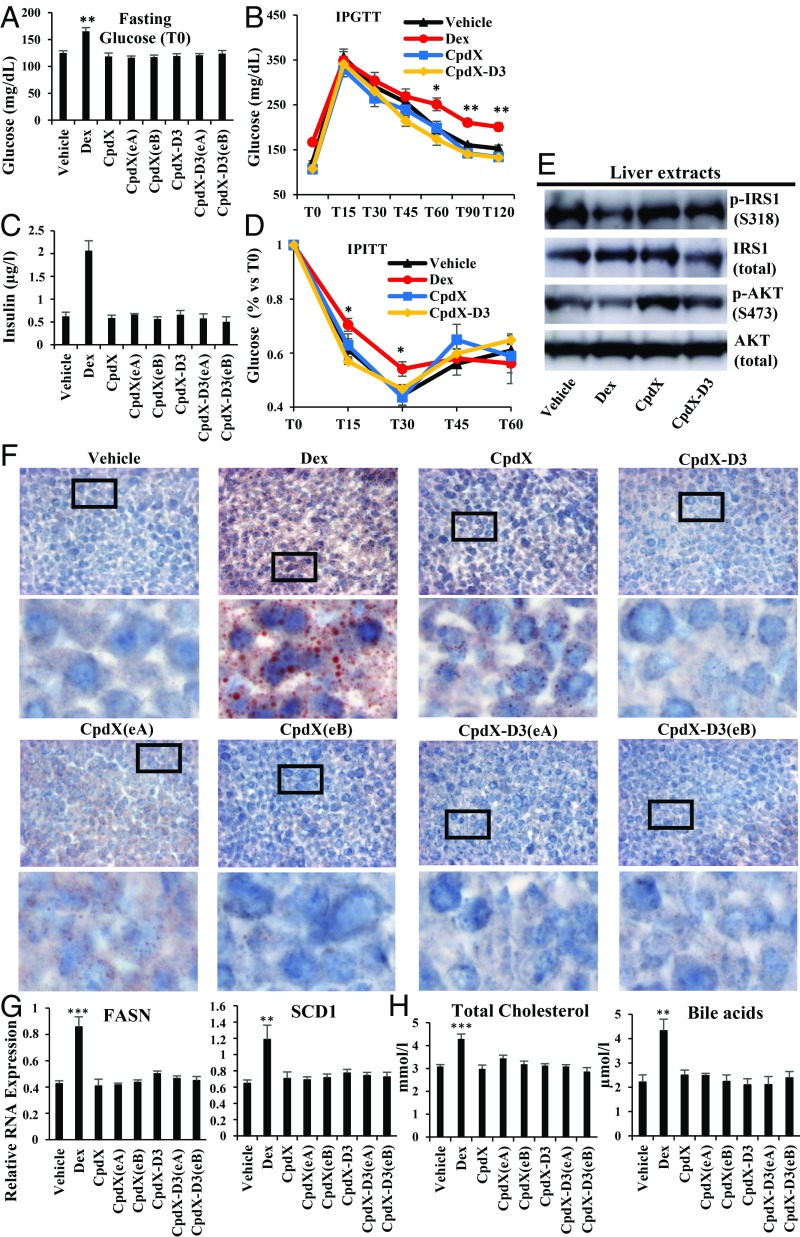
Fig. 5.
Unlike Dex, a 3-mo treatment with CpdX, CpdX-D3, or any of their enantiomers does not induce type 2 diabetes syndrome nor a fatty liver. (A) Plasmatic glucose levels (after an overnight 14-h fasting) from mice treated for 3 mo as indicated. Data are represented as mean ± SEM for, at least, nine mice per treatment as indicated. The statistical significance of the data, compared with vehicle treatment, was calculated by Student t test; (**) P < 0.01. (B) Two-h i.p. glucose tolerance test (IPGTT) after a glucose i.p. injection (2 mg/kg body weight). Data are represented as mean ± SEM for, at least, six mice per treatment as indicated. The statistical significance of the data, compared with vehicle treatment, was calculated by Student t test; (*) P < 0.05; (**) P < 0.01. (C) Blood insulin levels (µg/L) at 10 AM in mice treated for 3 mo as indicated. Data are represented as mean ± SEM for, at least, nine mice per treatment. (D) One-h i.p. insulin tolerance test (IPITT) after an i.p. injection of 0.75 U Insulin/kg body weight. Data are represented as mean ± SEM with, at least, six mice per treatment. The statistical significance compared with vehicle treatment was calculated by Student t test, (*) P < 0.01. (E) Western blot analyses of liver samples of mice treated for 3 mo as indicated for phosphoinsulin receptor substrate-1 phosphorylated at serine 318 (p-IRS1 S318), pan-insulin receptor substrate-1 (IRS total), phosphoprotein kinase B phosphorylated at serine 473 (p-AKT S473), and pan-protein kinase B (AKT total) proteins. (F) A 5% red oil staining of frozen liver sections from mice treated for 3 mo as indicated. In each case, the Lower is an enlargement of the region located within the square as indicated in the Upper. (G) Q-RT-PCR for transcripts of fatty acid synthase (FASN) and stearoyl-CoA desaturase 1 (SCD1) genes in livers of mice treated for 3 mo as indicated. The data correspond to the mean ± SEM for, at least, nine mice per treatment. The statistical significance was calculated by Student t test; (**) P < 0.01; (***) P < 0.001. (H) Levels of total cholesterol (mmol/L) and bile acids (µmol/L) in blood collected at 10 AM from mice treated for 3 mo as indicated. Data are represented as mean ± SEM for, at least, nine mice per treatment.

