Fig. 2.
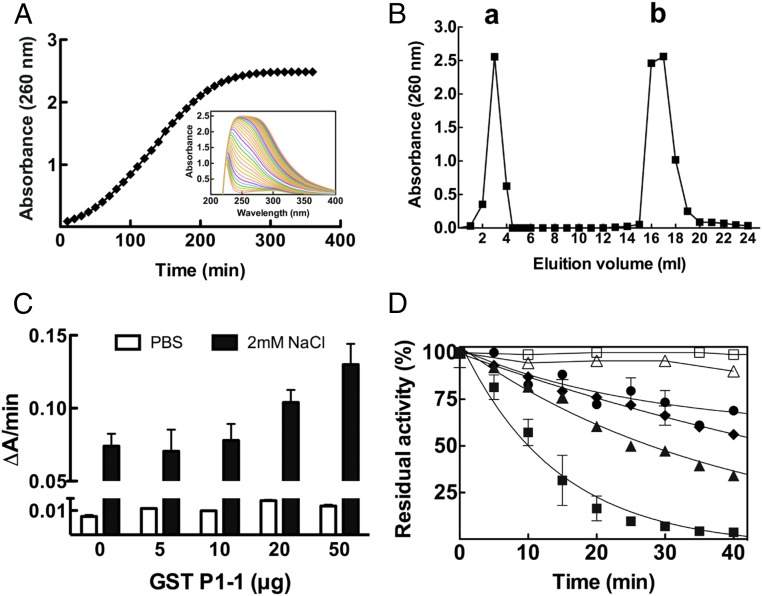
cis-DDP–GSH adduct formation is not affected by GST P1-1 enzymatic activity. (A) UV spectral change during the reaction of cis-DDP with GSH. cis-DDP (1 mM) was incubated with GSH (2 mM) in PBS at 37 °C for 6 h. Every 10 min, the adduct formation was followed spectrophotometrically by measuring its absorbance at 260 nm. (Inset) The UV spectral change during 6 h. (B) Purification of the cis-DDP adduct of GSH. After incubation of cis-DDP with GSH, the reaction product was eluted from an anion-exchange column with 0.2 M HCl, and the elution profile was monitored at 260 nm. Peak a represents the unbound cis-DDP while peak b contains the GS-Pt adducts collected after elution with 0.2 M HCl. (C) Reaction of cis-DDP with GSH in the presence of GST P1-1. The rate of adduct formation, either in PBS or in 2 mM NaCl (pH 7.4), was followed at 260 nm at 37 °C for 10 min and reported as the change in absorbance per minute (∆A/min), in the absence or in the presence of increasing amounts of GST P1-1. (D) Time course inactivation of GST P1-1 and its mutants in the presence of cis-DDP. □, GST P1-1 alone as control; △, GST P1-1 + 10 mM GSH + 1 mM cis-DDP in PBS; ●, GST P1-1 + 1 mM cis-DDP in PBS; ♦, Cys101Ser + 1 mM cis-DDP in 2 mM NaCl; ▲, Cys47Ser + 1 mM cis-DDP in 2 mM NaCl; ■, GST P1-1 + 1 mM cis-DDP in 2 mM NaCl. Data represent means ± SD of 3 independent experiments.

