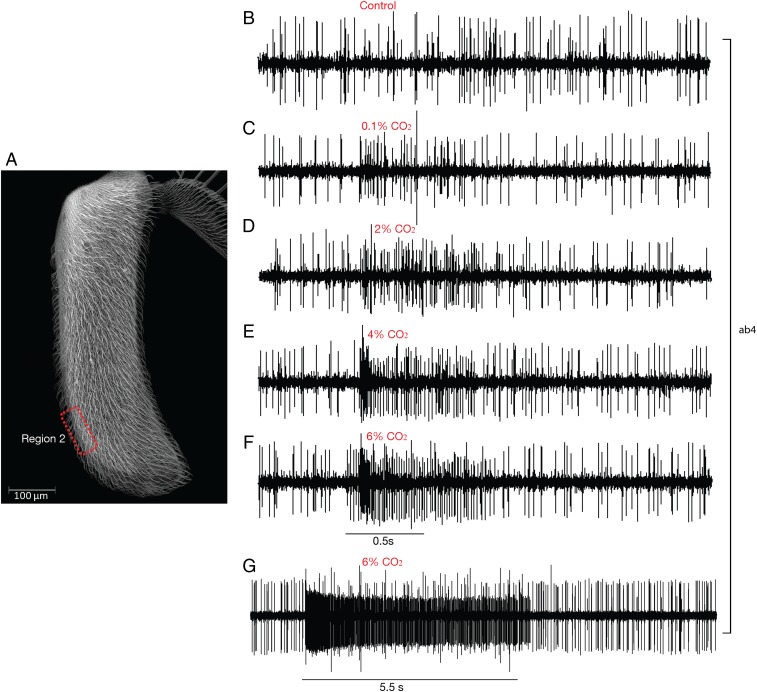
Fig. 6.
Responses to CO2 from one type of basiconic sensillum, ab4. (A) Region 2, from which recordings in this figure were made. (B–F) Responses from one individual sensillum to 500 ms pulses of increasing doses of CO2. B shows the response to a control pulse of air. (G) Response to a long CO2 stimulus.

