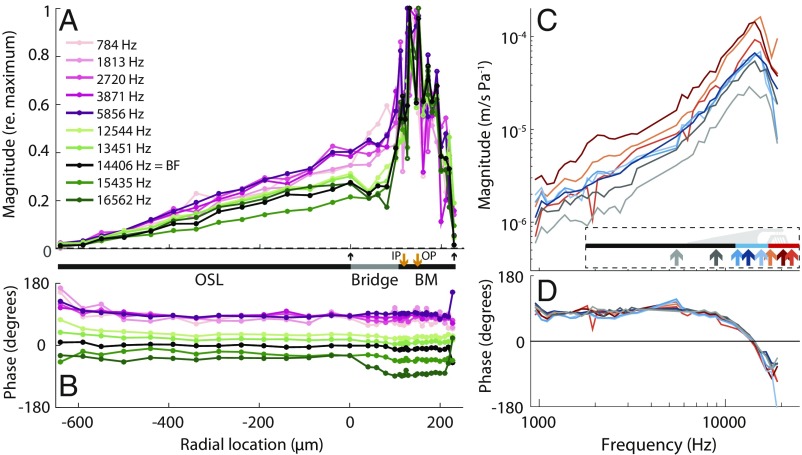
Fig. 2.
CP cross-sectional motion profiles and tuning curves. (A) Normalized CP transverse velocity magnitude versus radial location in response to tones over a wide range of frequencies (see frequency color key) for a representative temporal bone (#16). Velocity was normalized by the maximum velocity at each frequency. Upward arrows indicate the lateral edge of the OSL at 0 m and the lateral edge of the BM at 230 m. The thick line between A and B estimates the widths of CP structures; the orange arrows indicate the estimated locations of the bottoms of the inner pillar (IP) and outer pillar (OP). (B) CP transverse velocity phase referenced to the intracochlear vestibule pressure phase. (C) CP motion tuning-curve magnitudes and (D) phases referenced to vestibule pressure, at different radial locations (location color key shown on diagram in C). The BF of the BM was 14.4 kHz. Data were recorded for ear canal sound pressure levels of 108 dB SPL.

