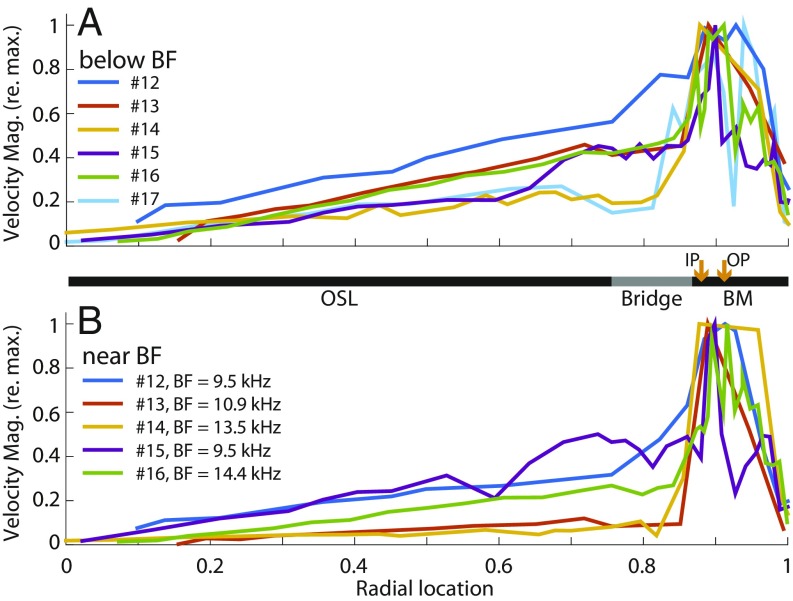
Fig. 3.
Motion of the CP referenced to maximum motion. (A) Average velocity below BF for each specimen (n = 6). (B) Average velocity near BF from each specimen (n = 5; see SI Appendix, Fig. S3 for more data.) The overall CP width was normalized to be from 0 to 1. Orange arrows indicate the estimated locations of the bottoms of the IP and OP. Ear canal sound was between 98 and 110 dB SPL (details in SI Appendix). Mag., magnitude.

