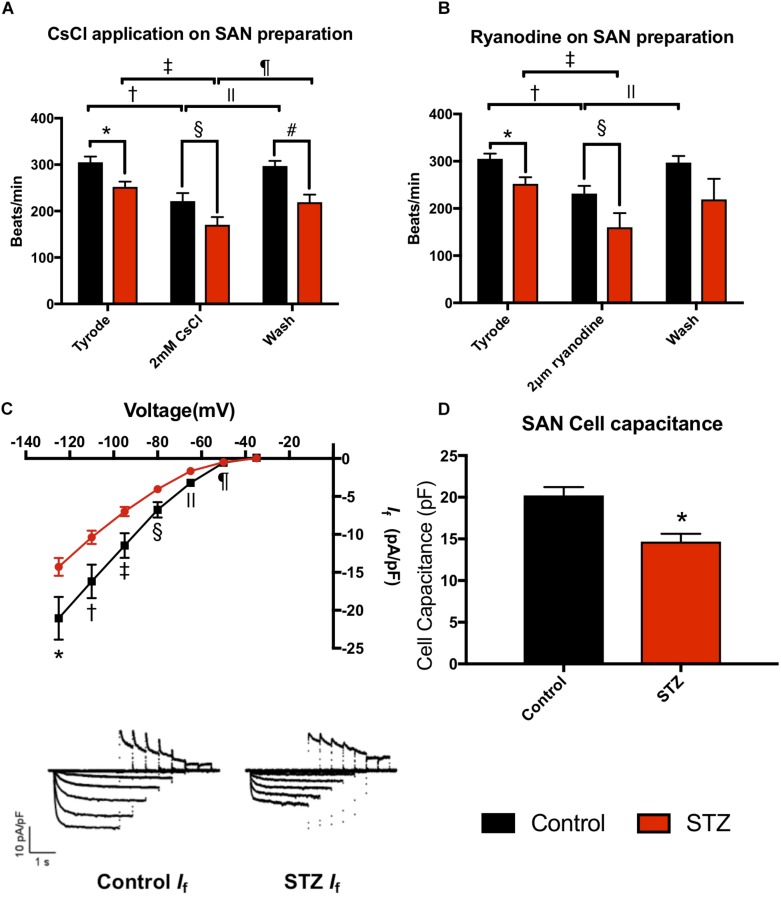
FIGURE 1.
Effect of STZ-induced type I diabetes mellitus on heart rhythm. (A) Mean heart rate recorded from the isolated SAN in normal Tyrode’s solution, on perfusing with 2 mM CsCl and on wash off of CsCl. Data from control (black bars; n = 4) and TIDM (red bars; n = 4) rats shown. (B) Mean heart rate recorded from the isolated SAN in normal Tyrode’s solution, on perfusing with 2 μM and on wash off of ryanodine. Data from control (black bars; n = 4) and TIDM (red bars; n = 4) rats shown. In (A,B), symbols shown significantly different. (C) Mean current-voltage relationship for If recorded from isolated SAN cells from control (black) and TIDM (red) rats. If density is plotted. Control: n = 4 rats, n = 29 cells. TIDM: n = 3 rats, n = 33 cells. Symbols show significantly different from corresponding control data. Representative traces of If from control and TIDM rats shown as an inset. (D) Mean cell capacitance of SAN cells from control and TIDM rats. Control: n = 4 rats, n = 29 cells. TIDM: n = 3 rats, n = 33 cells. *Significantly different from control. Data are means ± SEM; P < 0.05.

