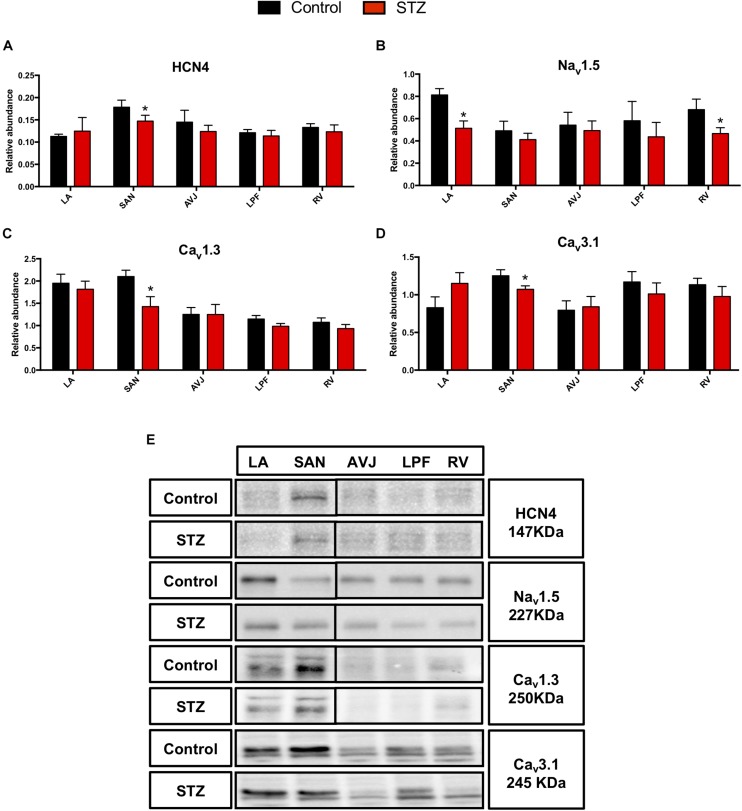
FIGURE 3.
Western blot of HCN4, Nav1.5, Cav1.3 and Cav3.1 and in STZ-induced diabetic rats vs. control rats. (A–D) Mean relative abundance (normalized to β-actin) of HCN4, Nav1.5, Cav1.3, and Cav3.1 in the LA (left atrium), SAN (sinoatrial node), AVJ (atrioventricular junction), LPF (left Purkinje fibers) and RV (right ventricle). (E) Western blot of SDS polyacrylamide gel electrophoresis of homogenized tissue samples obtained from STZ-induced type I diabetic hearts and controls labeled for HCN4, Nav1.5 Cav1.3, and Cav3.1 proteins. *Significantly different from control. Data are mean ± SEM (n = 5 for each group); P < 0.05.

