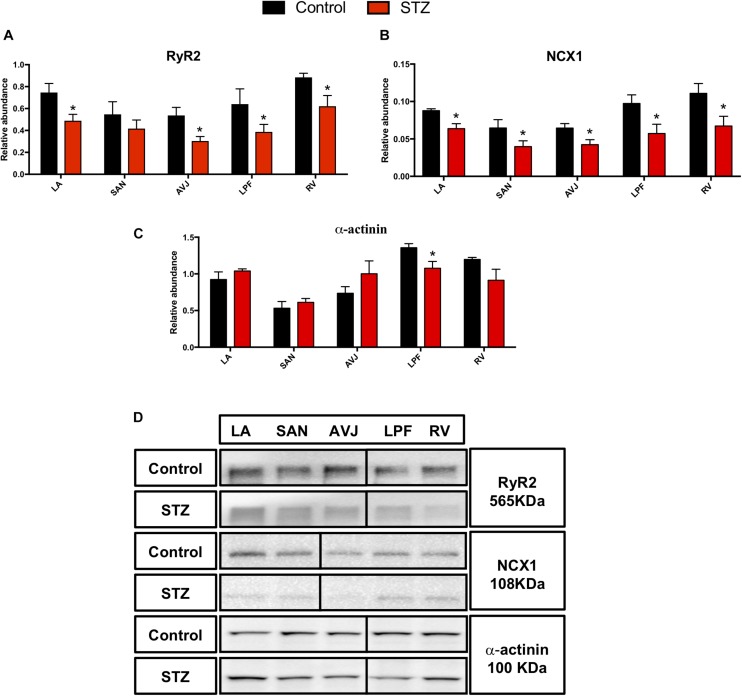
FIGURE 4.
Western blot of RyR2, NCX1, and α-actinin in STZ-induced diabetic rats vs. control rats. (A–C) Mean relative abundance (normalized to β-actin) of RyR2, NCX1, and α-actinin in the LA (left atrium), SAN, AVJ, LPF, and RV (right ventricle). (D) Western blot of SDS polyacrylamide gel electrophoresis of homogenized tissue samples obtained from STZ-induced type I diabetic rat and controls labeled for RyR2, NCX1, and α-actinin proteins. *Significantly different from control. Data are mean ± SEM (n = 5 for each group); P < 0.05.

