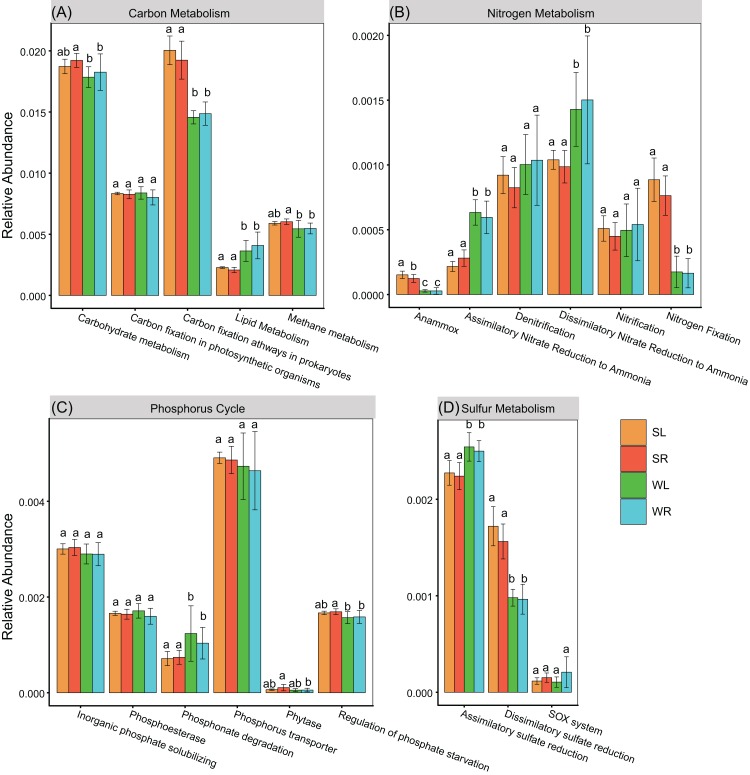
Figure 3. Relative abundance of genes associated to major pathways in (A) Central carbon metabolism, (B) nitrogen metabolism, (C) phosphorus cycle, and (D) sulfur metabolism.
For each pathway, the same lowercase letter indicates a non-significant difference, whereas the different letter indicates a significant difference between habitats (ANOVA, P < 0.05). P-values were adjusted by FDR correction.

