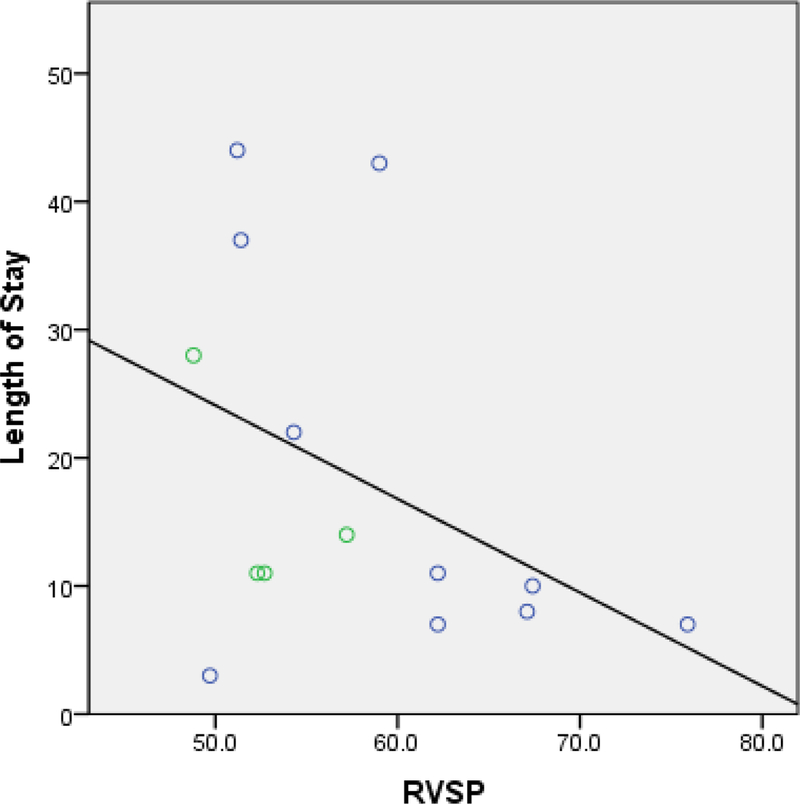
Figure 4: Scatterplot: Relationship between Length of Stay and RVSP in Subjects with RVSP > 1 STD.

Abbreviation: RVSP, right ventricular systolic pressure; STD, standard deviation
Blue open circle = subjects with normal right ventricular function
Green open circle = subjects with right ventricular dysfunction
