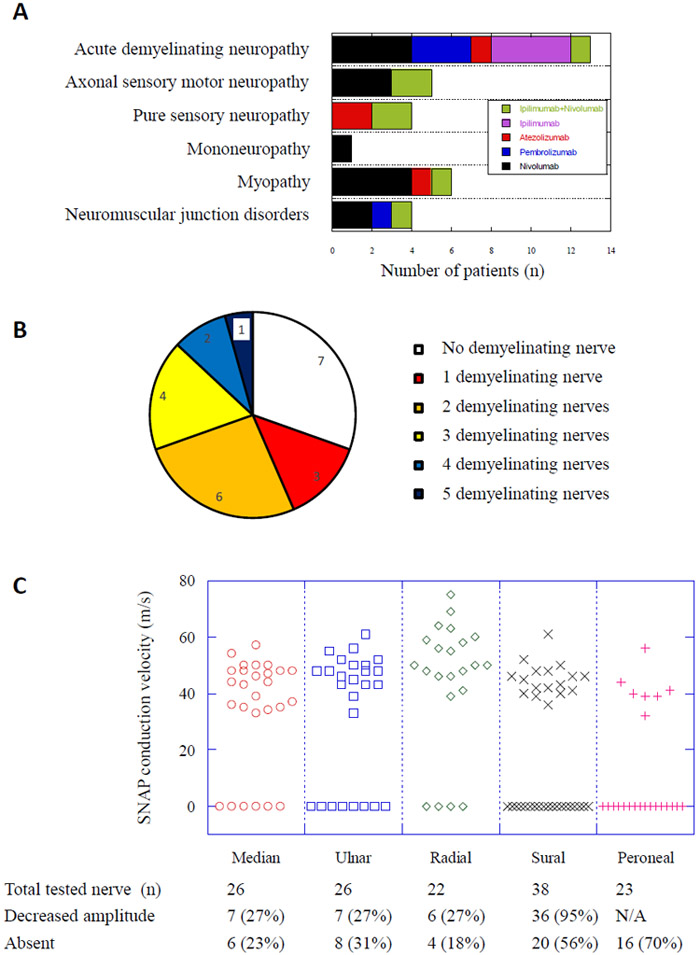
Figure 1.

Panel A showed number of cases with various neuromuscular disorders as diagnosed with electrodiagnostic studies and the inset showed the related checkpoint inhibitors as represented with various colors. Panel B showed the proportions of cases showing various numbers of motor nerves with demyelination findings, ranging from 0 to 5 nerves as indicated by different colors. Panel C showed the results of sensory nerve conduction study in median, ulnar, radial, sural and superficial peroneal nerves. The distributions of SNAP conduction velocity were demonstrated in the graph. The nerves with absent SNAP response were represented as 0 in the graph. The numbers of nerves tested and nerves showing either decreased amplitudes or absent response were shown at the bottom.
