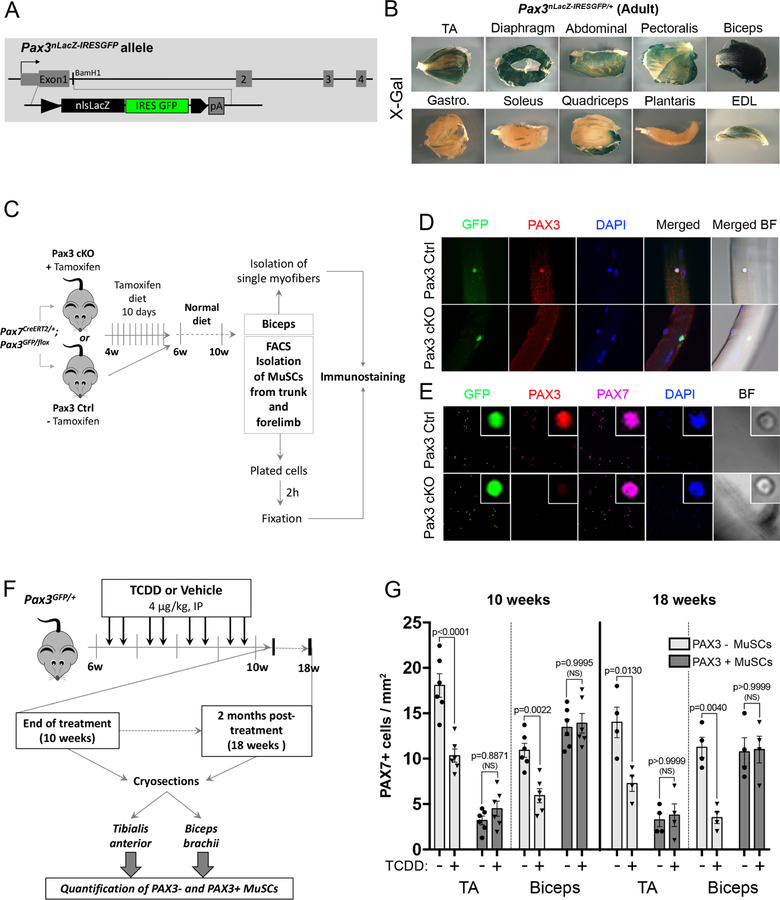
Figure 2. Differential loss of MuSCs exposed to TCDD is linked to muscle-specific expression of PAX3.
(A) Construction of Pax3nLacZ-IRESGFP/+ mice: a nls-LacZ IRES-GFP cassette was inserted into the translation start site in exon 1 of the Pax3 gene to follow PAX3 spatiotemporal expression (see Material & methods for details).
(B) Representative picture of X-gal staining performed on different adult whole skeletal muscles from Pax3nLacZ-IRESGFP/+ adult (2 months) mice showing that PAX3-derived MuSCs subpopulation is differentially distributed within adult skeletal muscles. Scale bar, 1mm. TA: Tibialis Anterior, Gastro.: Gastrocnemius EDL: Extensor Digitorum Longus.
(C) Experimental design.
(D) Representative co-immunofluorescence staining of GFP (PAX3 reporter, green), PAX3 (red), and nuclei (DAPI, blue) performed on single myofibers. Scale bar 40µm. BF, brightfield.
(E) Representative co-immunofluorescence staining of GFP (PAX3 reporter, green), PAX3 (red), PAX7 (pink) and nuclei (DAPI, blue) performed on isolated MuSCs. Scale bar, 40µm (overview) or 5 µm (inset).
(F) Experimental design.
(G) Quantification of PAX7+ cells per surface area (mm2) performed on Tibialis Anterior (TA) and Biceps brachii (Biceps) muscle sections from mice receiving TCDD (4µg/kg) or vehicle (nonane) and analyzed at the end of 4 weeks-treatment period (10 weeks) or 2 months (18 weeks) post-treatment. Means ± SEM (n=4–6), two-way ANOVA. P values calculated by Sidak’s post-test. NS, not significant.

