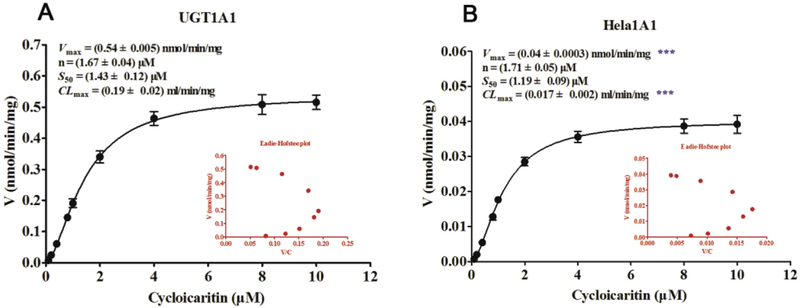
Fig. 3. Kinetic profiles for cycloicaritin-3-O-glucuronidation by recombinant UGT1A1 enzyme and HeLa1A1 cell lysate.
(A) Kinetic profile for cycloicaritin-3-O-glucuronidation by expressed UGT1A1. (B) Kinetic profile for cycloicaritin-3-O-glucuronidation by HeLa1A1 cell lysate. In each panel, the insert figure showed the corresponding Eadie-Hofstee plot. Each data point was the average of three determinations with the error bar representing the S.D. (n = 3). (* Parameters were compared with the same parameters of CICT-3-G by UGT1A1, ***p < 0.001).

