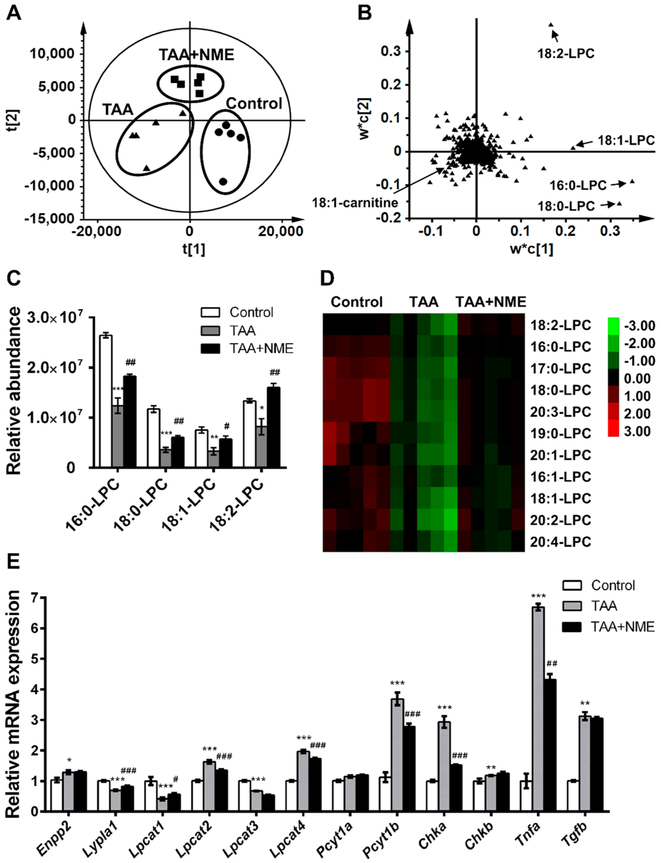
Figure 3.
Metabolomics analysis of phospholipids in mouse plasma. (A) PLS-DA model of plasma samples from control group, TAA-treated group, and NME protected group under ESI+ mode. These three groups were well separated from each other. (B) Loading scatter plot of PLS-DA model. Metabolites contributing to the separation of three groups were labeled. (C) NME significantly recovered the phospholipid homeostasis in mouse plasma. (D) Heat map analysis of the relative abundances of phospholipids. (E) QPCR analysis of mRNAs involved in LPC metabolism and PC synthesis. The t[1] and t[2] values express the scores of each sample in principal components 1 and 2, respectively. The w*c[1] and w*c[2] values express the contributing weights of each ion to principal components 1 and 2. *p < 0.05 as compared with control group, **p < 0.01 as compared with control group, ***p < 0.001 as compared with control group, #p < 0.05 as compared with TAA-treated group, ##p < 0.01 as compared with TAA-treated group, and ###p < 0.001 as compared with TAA-treated group.

