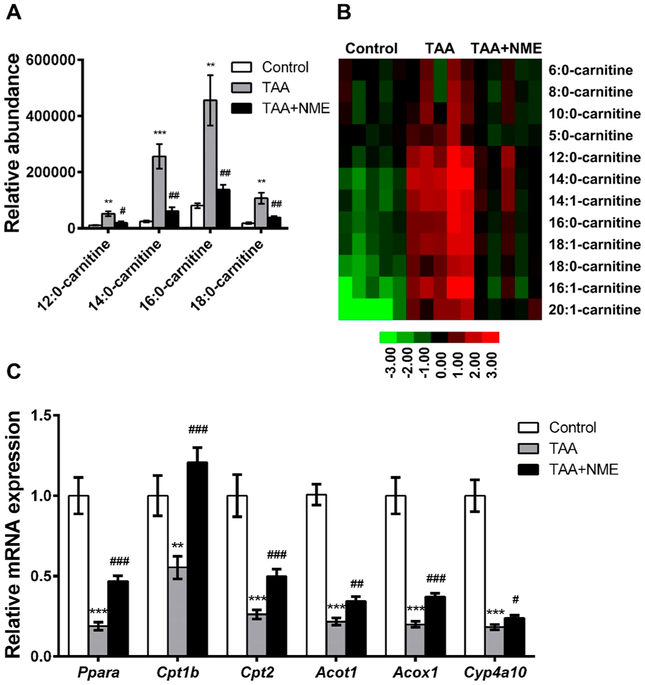
Figure 4.
Metabolomics analysis of acylcarnitines in mouse plasma. NME recovered the abnormal metabolism of acylcarnitine. (A) NME significantly recovered the acylcarnitines homeostasis in mouse plasma. (B) Heat map analysis of the relative abundances of acylcarnitines. (C) Expression of acylcarnitine transfer-related mRNAs. *p < 0.05 as compared with control group, **p < 0.01 as compared with control group, ***p < 0.001 as compared with control group, #p < 0.05 as compared with TAA-treated group, ##p < 0.01 as compared with TAA-treated group, and ###p < 0.001 as compared with TAA-treated group.

