
Figure 1.
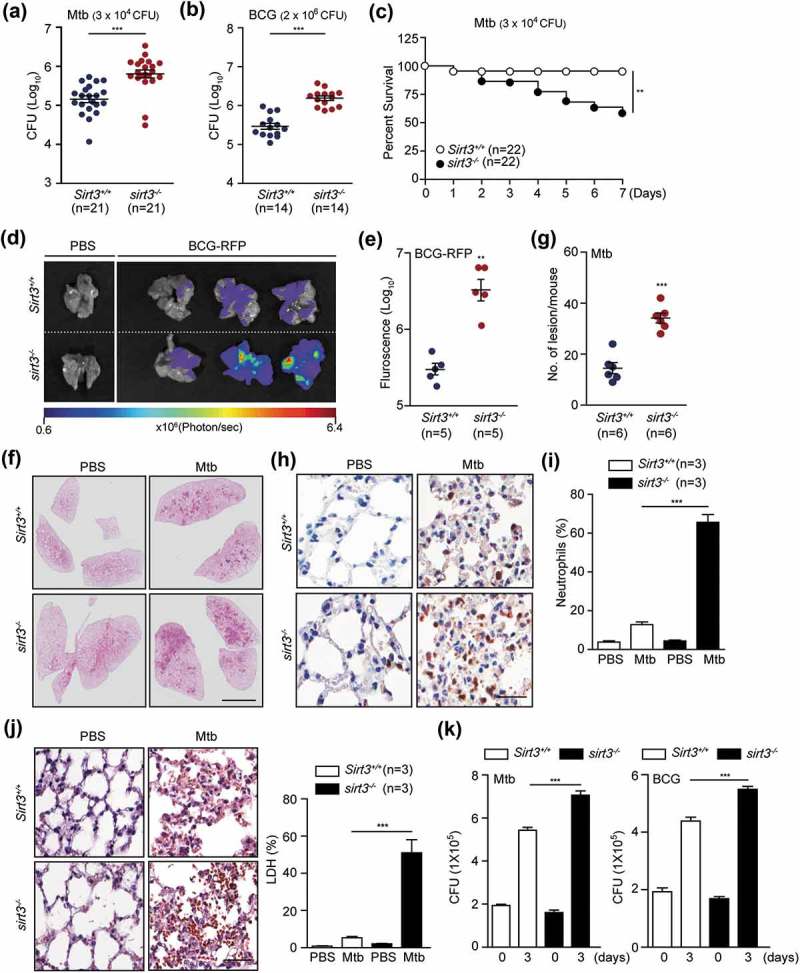
SIRT3 is essential for antimicrobial responses against mycobacterial infection in vivo and in vitro. (a-g) Sirt3+/+ and sirt3−/- mice were infected intranasally with various CFU of Mtb (3 × 10⁴ CFU) or BCG (2 × 10⁶ CFU), and monitored at 7 days post infection (dpi). (a and b) log pulmonary CFU (n = 21 for A; n = 14 for b per group). (c) Survival (n = 22, per group). (d and e) In vivo imaging of BCG-RFP-infected lungs from Sirt3+/+ and sirt3−/- mice. Mice (n = 5 each group) were infected intranasally with BCG-RFP (2 × 10⁶ CFU) for 7 dpi prior to sacrifice. (d) Representative in vivo imaging of bacterial fluorescence in representative mice. (e) Quantitative analysis of signal intensity in the infected lungs was assessed by measuring the total photon flux. (f) Lung histopathology by h&e staining of Sirt3+/+ and sirt3−/- mice infected with Mtb for 7 days. Scale bars: 3 mm. (g) The number of granulomatous lesions in lungs of Sirt3+/+ and sirt3−/- mice infected with Mtb for 7 days. (h and i) Neutrophil counts in lung tissues (Representative images for h, Scale bars: 60 µm; numbers of infiltrating neutrophils counted from 10 random fields for I) of Sirt3+/+ and sirt3−/- mice infected with Mtb for 7 days (3 × 10⁴ CFU). (j) Positive immunoreaction for localization of LDH, as an indicator of necrosis, in lung tissues (Representative images for left, Scale bars: 60 µm; numbers of LDH counted from 10 random fields for right) of Sirt3+/+ and sirt3−/- mice infected with Mtb for 7 days (3 × 10⁴ CFU). (k) Intracellular survival of Mtb assessed by CFU assay. Sirt3+/+ and sirt3−/- BMDMs were infected with Mtb (MOI = 1, for left) or BCG (MOI = 10, for right) for 4 h, and then lysed to determine intracellular bacterial loads at 0 and 3 dpi. *P < 0.05, **P < 0.01, ***P < 0.001. Mann-Whitney U test (a, b, e, and g), log-rank (Mantel-Cox) test (c) or Two-way ANOVA (i-k). Data are the combined results from three or four independent experiments (a-c), representative of three independent experiments (d, f, h and j left), and values represent means (± SEM) from three or four independent experiments performed in triplicate (e, g, i, j right, and k).