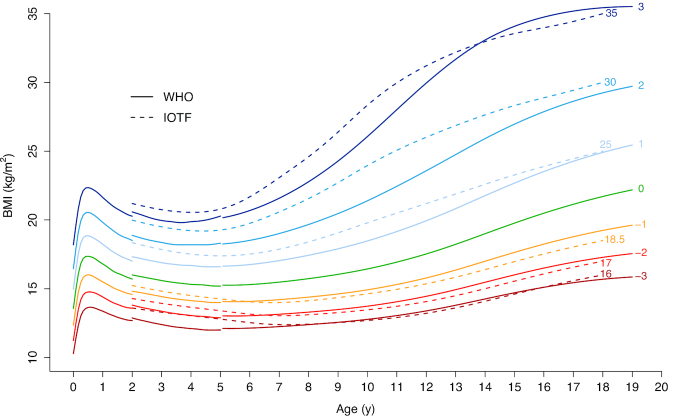
FIGURE 2.
WHO and IOTF BMI growth curves for boys. WHO growth curves for children <5 y are based on the 2006 WHO Child Growth Standard (29). WHO growth curves for children and adolescents 5–19 y are based on the 2007 WHO Growth Reference (24). IOTF curves are based on the 2012 IOTF extended cutoffs for children and adolescents 2–18 y (40). Data were fitted using cubic smoothing splines. Numbers at the end of the IOTF growth curves (dotted lines) specify the corresponding adult BMI values. Numbers at the end of the WHO curves represent the corresponding z scores (SDs). Colors are used to differentiate between different levels of severity. Severity levels are defined as follows: BMI < 16 or BMIZ < −3, grade 3 (severe) thinness; BMI < 17 or BMIZ < −2, grade 2 (moderate) thinness; BMI < 18.5 or BMIZ < −1, grade 1 (mild) thinness; BMI ≥ 25 or BMIZ ≥ +1, overweight; BMI ≥ 30 or BMIZ ≥ +2, obesity; BMI ≥ 35 or BMIZ ≥ +3, severe obesity. For children aged 0–5 y, WHO defines overweight as BMIZ ≥ +2 and obesity as BMIZ ≥ +3. BMIZ, BMI-for-age z score; IOTF, International Obesity Task Force.

