FIGURE 3.

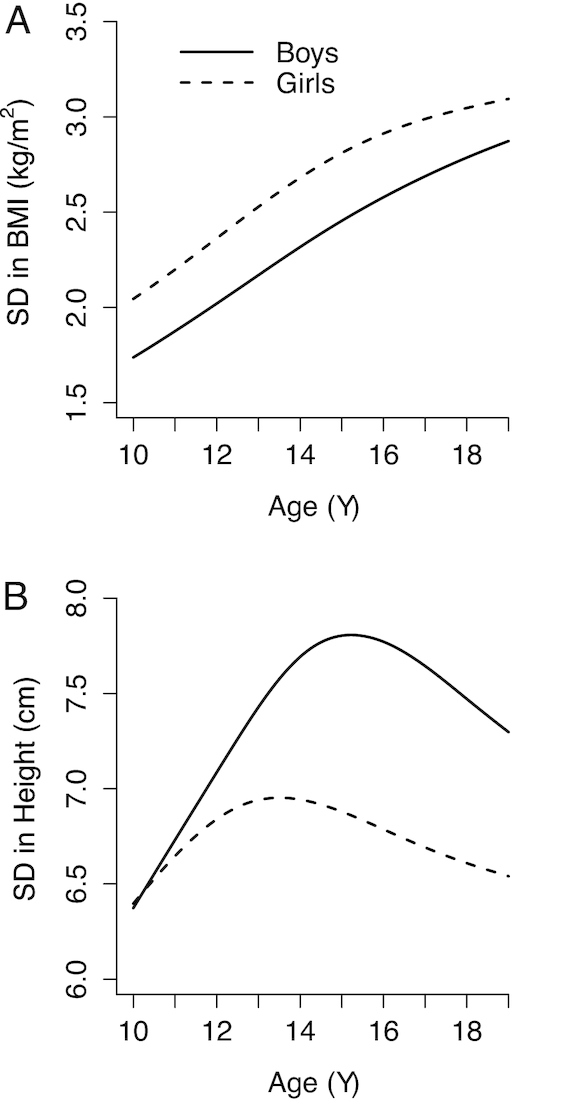
SDs of BMI (A) and height (B), from the 2007 WHO Growth Reference by age and sex (24). Data were fitted using cubic smoothing splines.

SDs of BMI (A) and height (B), from the 2007 WHO Growth Reference by age and sex (24). Data were fitted using cubic smoothing splines.