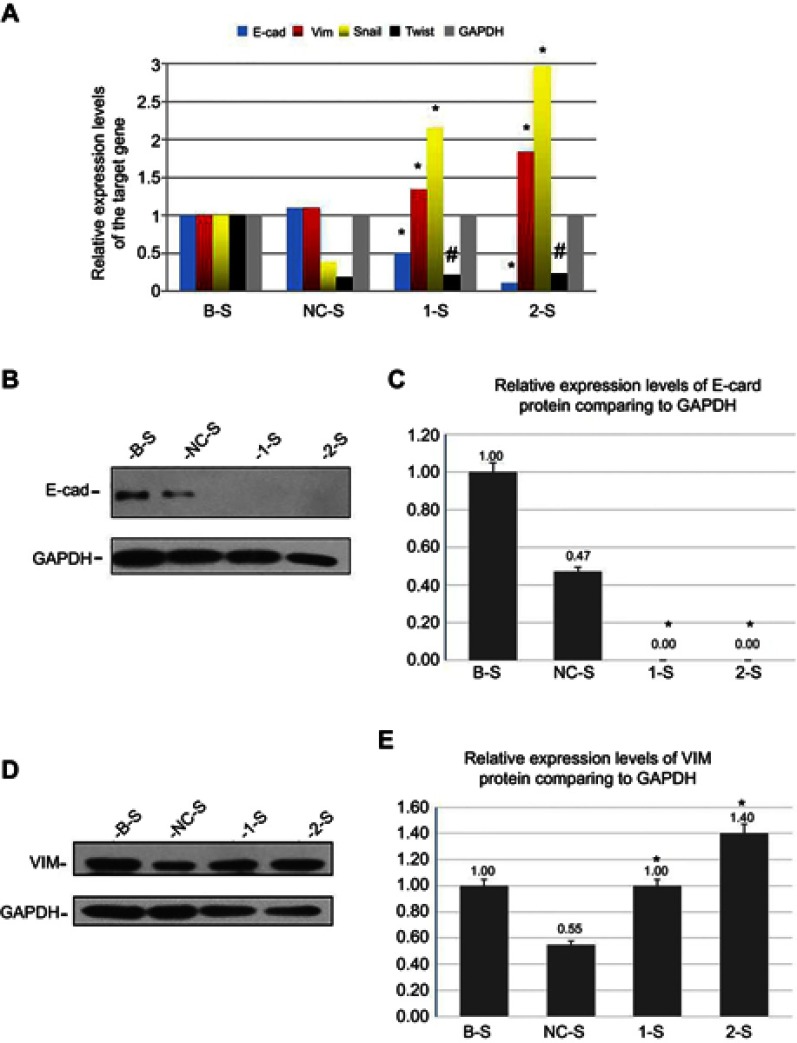
Figure 3.
Detection of EMT-related genes in the monoclonal recombinant lentivirus-transfected PANC-1 cell lines.
Notes: (A) Histogram of the relative quantification and expression levels of the target gene (E-cadherin, vimentin, Snail, Twist, and GAPDH). *Indicates a statistically significant difference (p<0.05). #Indicates that the difference is not statistically significant (p>0.05). By using Western blot,the gel figure of the relative expression levels of E-cadherin (B and C) and vimentin (D and E) proteins and the histogram analysis results of the stable transfected cell lines. *Indicates a statistically significant difference (p<0.05) (every data was repeatedly measured 3 times,take the average of 3 measurements; the B-S group was used as the control).
Abbreviations: E-cad, E-cadherin; VIM, vimentin; 1-S, LV-shTPM3-1-sample; 2-S, LV-shTPM3-2-sample.

