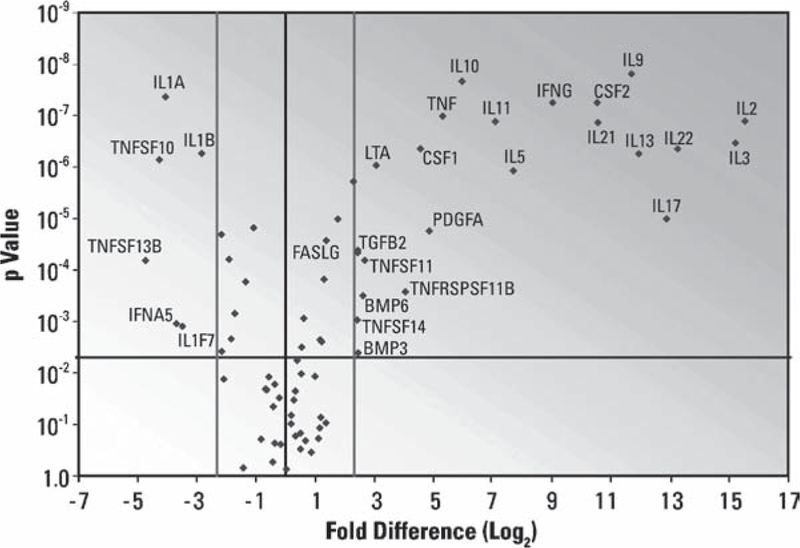
Fig. 8.

Typical Result from a SuperArray PCR Array. RNA isolated from resting PBMC or PBMC stimulated with PMA and ionomycin for 6 h were characterized on the Human Common Cytokine RT2 Profiler PCR Array. Log2 fold-changes in gene expression between stimulated and resting PBMC are plotted against t-test p-values to produce a “volcano plot.” Genes in the extreme upper left and right sections of the graph have larger, more statistically significant changes in gene expression. Thresholds: fold-change (light lines), > fivefold; statistical significance (dark line), p < 0.005.
