
Figure 2.
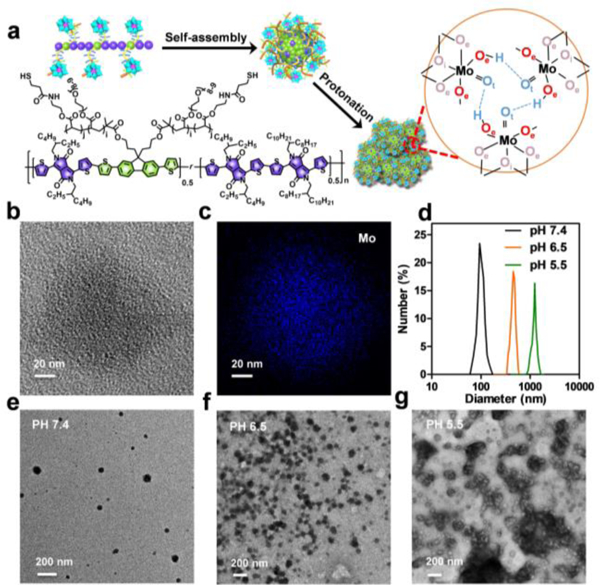
a) Schematic of the structure of SPB, synthesis of SPB@POM and mechanism of acidity-induced aggregation of SPB@POM. b) High-resolution TME image and c) its corresponding elemental mapping of SPB@POM. d) Dynamic light scattering profiles and e, f, g) TEM images of SPB@POM in solutions with different pH values (pH 7.4, 6.5, and 5.5).