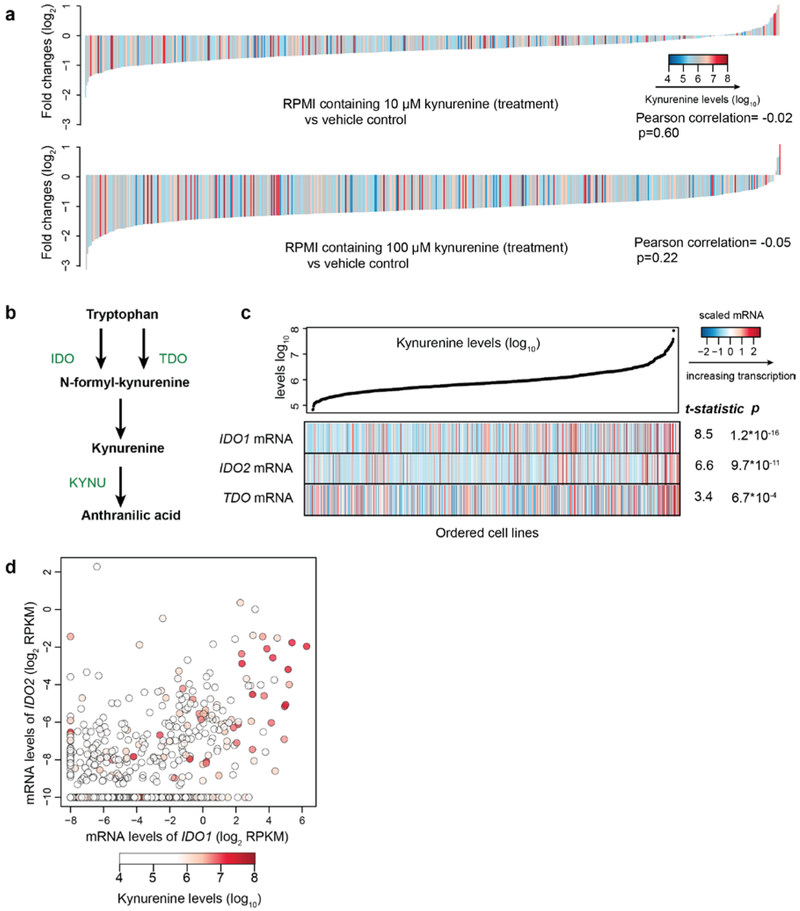
Extended Data Fig. 6 ∣. Kynurenine metabolism in the CCLE.
a, Waterfall plots showing the fold changes of pooled CCLE lines (n=554, median of 3 independent cell culture replicates) cultured in RPMI media containing 10 μM or 100 μM kynurenine for 6 days (normalized to control). The colors show the associated kynurenine levels in cells. The p-values were calculated based on the significance test of Pearson correlations (two-sided). b, Schematic depicting part of the tryptophan catabolism pathway. c, Kynurenine levels and a heatmap representation of top correlated mRNA transcripts in each cell line. The feature values (log2 RPKM) were standardized for plotting. The reported test statistics and p-values are based on the significance tests of mRNA feature regression coefficients (cell line n=913, two-sided t-tests). d, mRNA levels of IDO1 and/or IDO2 correlate with kynurenine accumulation (Pearson correlation= 0.26 and 0.22 respectively; two-sided p<10−15 and p=2.5*10−11 respectively). Cell lines (n=913) are represented as points with color-coded kynurenine levels.

