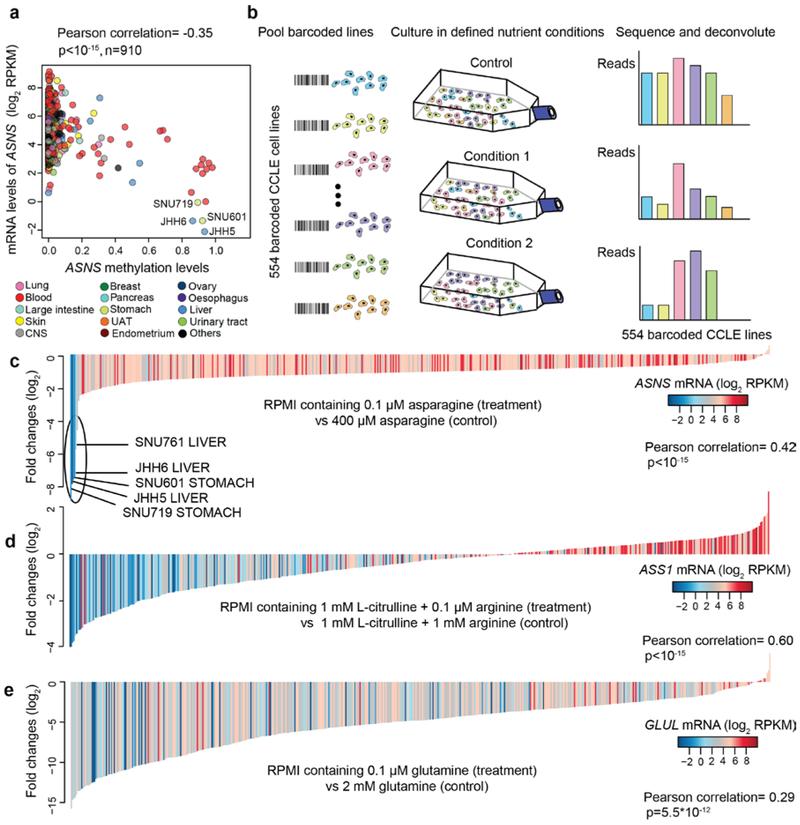
Fig.4 ∣. Revealing amino acid metabolism auxotrophs by pooled cancer cell line screens.
a, Scatter plot comparing ASNS DNA methylation levels with ASNS mRNA levels in all cell lines. b, Schematic summarizing the workflow of pooled cancer cell line screens. c-e, Waterfall plots showing the fold changes of pooled CCLE lines (n=554, median of 3 independent cell culture replicates) cultured in RPMI media containing 0.1 μM asparagine (c), 0.1 μM arginine + 1 mM L-citrulline (precursor required for arginine synthesis) (d), 0.1 μM glutamine (e) for 6 days (normalized to control). For c-e, the p-values were calculated based on the significance test of Pearson correlations (two-sided).

