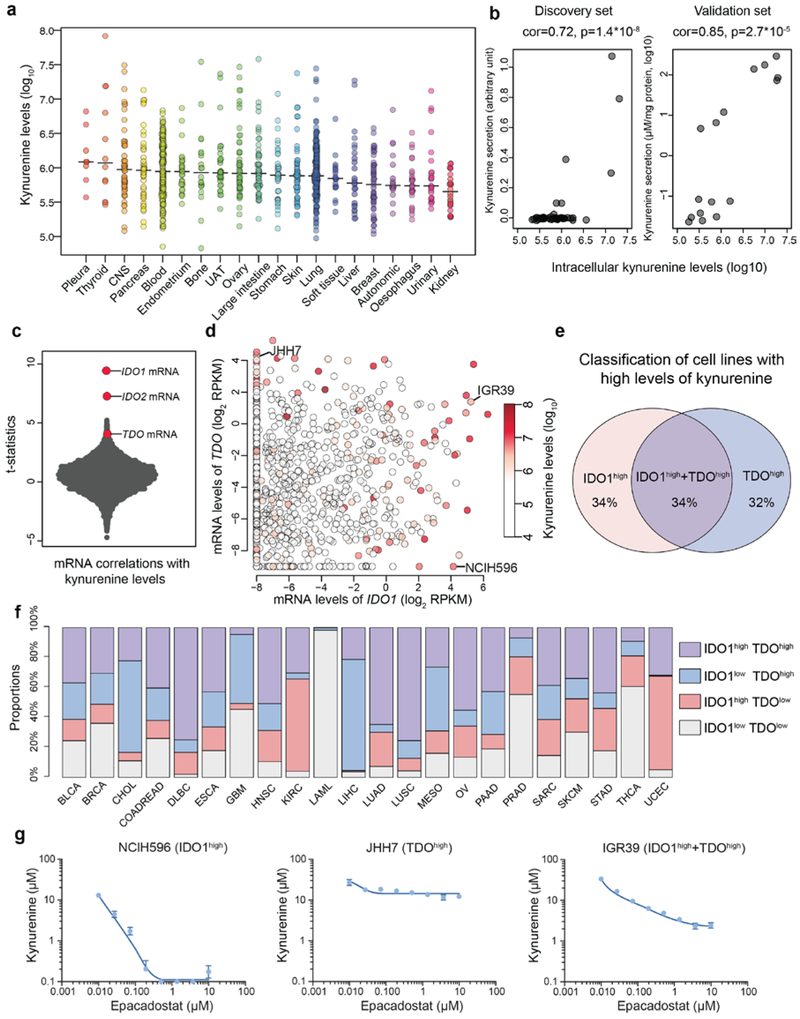
Fig.6 ∣. The landscape of kynurenine metabolism in the CCLE.
a, Kynurenine levels with medians across the CCLE cell lines grouped by tissues of origin. b, Scatter plot showing intracellular kynurenine levels compared to secreted kynurenine levels in the selected cell lines (discovery set: n=49; validation set: n=16). Two cell culture replicates were used for each cell line in the validation set. The p-values were calculated based on the significance test of Pearson correlations (two-sided). c, T-statistics based on all gene transcripts and the basal levels of kynurenine conditioned on the major lineages. Each point represents a gene. The statistical test was based on linear regression conditioned on major lineage types (cell line n=913). d, mRNA levels of IDO1 and/or TDO correlate with kynurenine accumulation (Pearson correlation= 0.26 and 0.10 respectively; p<10−15 and p=0.002 respectively). Cell lines (n=913) are represented as points with color-coded kynurenine levels. e, Classification of cell lines with high kynurenine levels (the top 5% in the CCLE) based on their expression of IDO1 and TDO. Cell lines with IDO1/TDO mRNA transcripts lower than −2 (log2 RPKM) are considered to lack sufficient expression. f, Classification of TCGA tumor samples based on IDO1/TDO mRNA transcripts. The samples with above average IDO1/TDO levels were defined to be high in expression. The cancer type short names are based on standard TCGA notations. g, Kynurenine secretion to media in response to epacadostat in cell lines with expression of IDO1, TDO or both (mean ± SEM, n=3 cell culture replicates). The detection limit of the ELISA assay is 0.1 μM.

