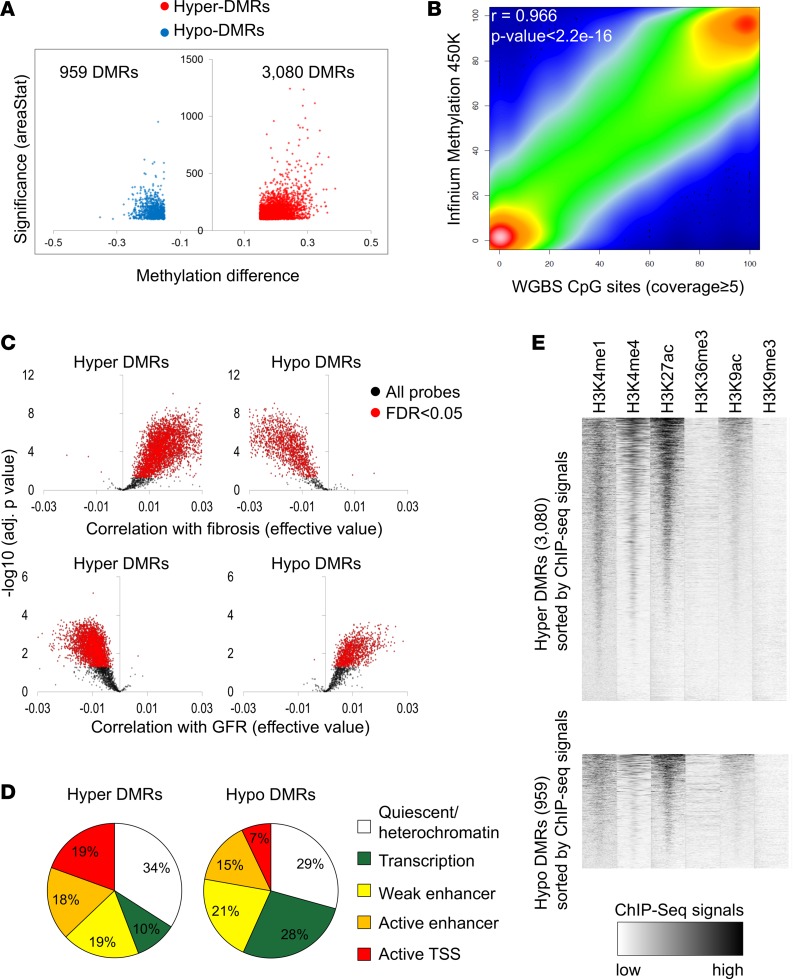
Figure 1. Whole-genome cytosine methylation analysis of control and DKD kidney tubule samples at base resolution.
(A) Volcano plot for the DMRs between control and DKD samples. The x axis represents methylation level difference. The y axis represents statistical significance of the DMRs shown by areaStat value from bsseq program. (B) The correlation between Infinium array and WGBS data. (C) Methylation patterns of the Infinium probes in the DMR regions identified by WGBS. The x axis represents correlation level (effective values calculated by linear regression) with interstitial fibrosis (upper panel) and GFR (lower panel). The y axis represents the significance of the correlation. The significant probes are colored in red (FDR < 0.05). (D) Genomic distribution of the DMRs in kidney-specific functional elements. Functional elements were defined by ChromHMM-based histone ChIP data. (E) Enrichment patterns of 6 different histone modifications in hyper- and hypo-DMRs. Normalized ChIP-seq read density was calculated for every 25-bp window in ±3 kb flanking DMR center.

